Messy in.Trusted out.

Open-source data preparation that runs on your own servers: connect your systems, build a flow on a canvas, publish a table people can trust.

Get startedRead the docs

  • AGPL-3.0, self-hosted on your servers. Every user, every flow, no licence count.

    Get started
  • Postgres, MySQL, Oracle, SQL Server, ClickHouse, Trino; files; folders on S3 and SFTP; SharePoint; any HTTP API.

    All the connectors
  • AGPL code, parquet in your own bucket, an open REST API, OpenLineage. A flow can also be exported as a dbt project.

    What you keep
  • Polars streams, DuckDB spills to disk, DuckDB and chDB read only the columns and row groups a query needs, and ClickHouse or BigQuery read the parquet where it lies. On a managed ClickHouse, an aggregation over 25 million rows answers in 0.6 s.

    The five engines
  • Docker Compose to try it, Helm on Kubernetes for production; your S3, your Postgres, your databases; OIDC sign-in; API tokens and signed webhooks.

    Integrations
  • Write Python and R in environments an administrator defines, or run the images your team already ships, as steps of the same flows: Kubernetes Jobs with limits, versions, logs and an audit trail.

    Code and containers
  • Rules checked before anything is published, and a lineage map of every flow and datasource, also sent out as OpenLineage.

    Governance
  • An append-only audit log that can go to Splunk, sessions you can revoke, roles and inherited permissions, an audit retention you set and the privacy notice quotes.

    Audit log to Splunk
  • Ask your data in plain language, let the editor’s assistant build the flow on the canvas, or have it write and fix your Python and R without ever seeing a row. Optional, on the provider you choose.

    The assistant
See how data from real systems becomes a table

Data rarely arrives clean. An export writes decimals with commas, a supplier drops a new file every night, a CRM table carries a column nobody documented.

Data and IT leaders want that work on infrastructure they control: their servers, their bucket, their sign-in, an audit trail of who ran what and which data was downloaded.

Analysts want to shape the data by clicking and see the result at every step. Data engineers want SQL, an API and nothing they cannot take with them.

Tabularia is built for all three, and it is AGPL-3.0 open source.

What it is, in the README

How it works

Publish

Publish it, every night.

A datasource for the reports, a table back in Postgres, a file on SFTP or S3, an email. On a schedule.

4 rows · 6 columns

Contract OK

publish the datasource «Daily sales»

orderStringdateDatecustomer_idInt64amountFloat64customerStringcityString
S-10412026-10-171011234.50Salumeria RossiMilano
S-10422026-10-1710286.00Bar CentraleMilano
W-22012026-10-1710459.90Hotel LagoComo
W-22022026-10-17102240.00Bar CentraleMilano

Published toDatasource · Daily salesPostgres · sales.daily (append)Email · Daily sales {yesterday:dd/MM/yyyy}

Sample data, shown as the editor’s preview shows it.
One flow, five engines

A flow carries two engines: one for the editor, one for production. The flow does not change by a single node.

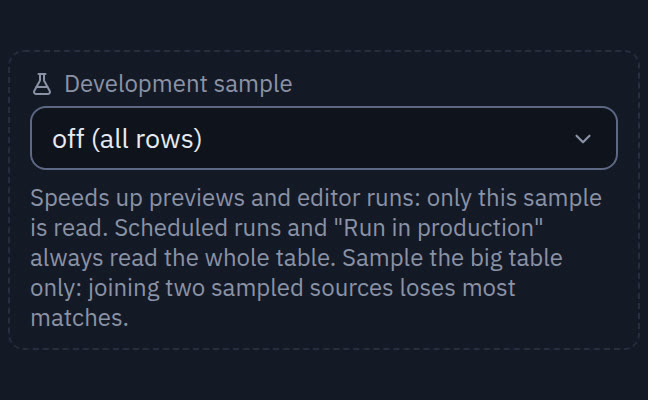
Design on Polars, schedule on ClickHouse or BigQuery — on the whole table, with an optional development sample where reads are billed; every run records the engine it ran on.

The engines follow one data standard (nulls, casts, joins, aggregates, sort order, pivots), checked by an oracle test suite that runs the same expectations on all five. The differences that remain are documented, not discovered in production.

The documented engine differences

Flow settings

Production engine
Runs
On your ClickHouse; with the s3 transport it reads the parquet in place
Needs
A ClickHouse the workers can reach
Billed by
The server you run

Your code and your containers, governed

When a click is not enough, the data team writes Python or R, or runs the image it already ships: inside the same flows, with the same permissions, schedules and audit trail. On Kubernetes, as Jobs you can account for.

  • Write R and Python in a governed environment

    Administrators define the environments: the language version, the packages pinned, the groups that may use them, the variables and the secrets. Tabularia builds the image and runs every script as a Kubernetes Job in its own namespace, with CPU and memory limits, network policies and a timeout. Scripts are saved in folders with their versions; Python is checked by Ruff as you type; every run keeps its log.

    Python and R in flows →
  • An assistant that never sees your data

    Beside the code, it writes and fixes Python and R for the script’s environment. It gets the code, the packages, the names and types of the columns and the error of a failed run: never a row. What it proposes is applied only when you say so.

  • Orchestrate your containers

    Any image of your registries (Harbor, GitHub, GitLab, Docker Hub, your cloud’s), from the repositories an administrator allows to each group. Set the command, the arguments, the variables, CPU and memory: the container gets its input as parquet and hands back its output, or simply does its job elsewhere. Retries, timeouts, logs and the outcome come with it.

    The Container node →
  • One schedule for all of it

    A flow group runs steps in order and cells side by side: refresh the sources, run the flows, a script and a container, then email the results as Excel files. A failed step stops the ones after it, and every cell checks its rights again when it runs.

Nothing you cannot take with you

No proprietary store: what Tabularia keeps is in formats and interfaces you already use. (The bundled Grafana keeps its own default analytics and update checks unless you turn them off.)

  • Open source

    AGPL-3.0, the code and the issues on GitHub, no per-seat fees.

  • Self-hosted

    Docker Compose to try it, Helm on Kubernetes for production, with your own Postgres, S3 and Valkey if you prefer.

  • Parquet in your bucket

    Every datasource and result is a parquet file on your object storage: MinIO, S3, Scaleway or Google Cloud Storage.

  • An open API

    REST, with read-only or read-write tokens that expire and never exceed their account’s permissions.

  • OpenLineage

    Runs, inputs and outputs reported to the catalogue you choose, in the open standard.

  • A dbt project, if you want one

    A flow can be exported as a dbt project. What the export covers, and its limits

Fits the stack you run

Named for what they are: the systems Tabularia talks to, and the standard each one speaks.

API, tokens and webhooks

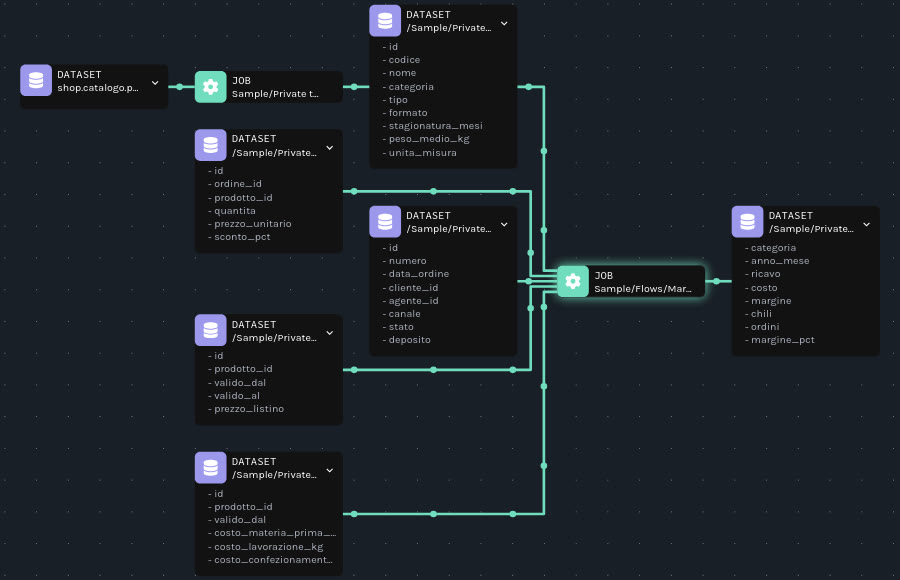
A Tabularia flow in Marquez: the datasources it read on the left, the flow job in the middle, the datasource it published on the right, each with its columns.
One flow run, as Marquez receives it through OpenLineage.
  • Orchestrators and CI

    The REST API, API tokens and service accounts let any orchestrator (Airflow, a CI job, a scheduler) start a flow and read its results; signed webhooks tell it when the run ends.

  • Data catalogues

    OpenLineage events to Marquez, DataHub or any collector: names, schemas, queries and paths, never rows.

  • SIEM

    Every audit entry forwarded to Splunk’s HTTP Event Collector, nothing skipped while Splunk is down.

  • Single sign-on

    Any OIDC provider (Keycloak, Microsoft Entra ID, Okta, Auth0…), verified against Keycloak; identity-provider groups map onto Tabularia groups by name.

  • Monitoring

    VictoriaMetrics and Grafana dashboards: task durations, cache hit rate, storage growth, preview latency.

  • An AI assistant, optional

    Any OpenAI-compatible endpoint, including one you host; an administrator decides which models may be used.

Governed from the first run

Sessions that can be closed, secrets encrypted at rest, and about a hundred settings an administrator changes from the panel, most of them without a restart.

  • Data contracts

    Columns, types and rules checked before publishing. An error blocks the publish; the last good data keeps serving.

  • Single sign-on

    Any OIDC provider (Keycloak, Entra ID, Okta, Auth0…), verified against Keycloak; local sign-in stays as break-glass.

  • Inherited permissions

    Users, groups and nested projects with view, edit, manage and connect.

  • An audit log that answers

    Who signed in, who ran what, which data was downloaded. Append-only, and it can be forwarded to Splunk.

  • Free-form SQL, contained

    A SQL node reads its own input. On ClickHouse, chDB and BigQuery the query is parsed and any other table is refused; DuckDB and Polars run it in a sandbox that sees only the input.

    SELECT * FROM information_schema.tables
    sql: the query can read only the input of the node (`self` or `input`). The table `information_schema.tables` is not allowed: to combine other data use a Join or Union node.
  • The whole table, by default

    Previews and runs read the full table: sampling is off unless you turn it on. A development sample is optional, for sources where every read is billed; scheduled runs always read everything.

    The Development sample setting of a source node at its default, “off (all rows)”: previews read the whole table. The note under it says a sample is only for speeding up previews, and that scheduled runs and Run in production always read everything.

Any source.Every day’s file.

Postgres, MySQL, MariaDB, ClickHouse, Trino, Oracle, Microsoft SQL Server (its driver is added by you), SharePoint (Excel and CSV); uploaded files (CSV, Excel, JSON, parquet) and folders on SFTP or S3 (CSV, Excel, NDJSON, parquet); HTTP APIs with page-number, offset-and-limit, cursor or next-link pagination, and API keys, bearer tokens, basic auth or OAuth2 client credentials. Results go to a datasource, a database table, SFTP, S3 or email, and a flow group can email several datasources as Excel files.

The placeholder language

The Datasources page: database tables from the sample company with their folders and row counts, two marked AI ready.

Edit it as a datasource’s file name: {day} and {day_end} (the range), {symbol} (a list), {today}, {now-2h}, {last_refresh}, formats such as {day:ddMMyyyy} or {now:%Y%m%d}. It is checked and resolved with the product’s rules and messages, for the selected day and the time zone you pick.

day = today-7 .. today step 1d

todaysales_20261017.csvsales_{day:yyyyMMdd}.csvYour name
06:00/in/2026/10/sales_17102026.csv/in/{day:yyyy}/{day:MM}/sales_{day:ddMMyyyy}.csvSFTP folder · Input
06:05GET /quotes/AAPL?from=2026-10-17&to=2026-10-18GET /quotes/{symbol}?from={day}&to={day_end}HTTP API · Input
06:10exports/2026/10/17/*.parquetexports/{day:yyyy/MM/dd}/*.parquetS3 folder · Input
06:40/out/2026/10/report_20261018_381.csv/out/{today:yyyy}/{today:MM}/report_{today:yyyyMMdd}_{run_id}.csvSFTP server · Output
07:00Daily sales 17/10/2026Daily sales {yesterday:dd/MM/yyyy}Email · Output

Sample schedule times; {symbol} is a list variable (AAPL, MSFT) and {run_id} the run’s number.

Then put it on a schedule.

Time-zone aware and DST-safe. The schedule load shows busy bands and collisions before they bite; flow groups chain refreshes, flows, scripts, containers and emails in steps.

Run it on your servers.

Docker Compose to try it on one machine, Helm on Kubernetes for production. Images for amd64 and arm64 on Docker Hub; the latest release on GitHub.

Most settings are environment variables: the configuration reference.

Get startedReleases on GitHub

git clone https://github.com/JumpAsAService/Tabularia.git
cd Tabularia/infrastructure
docker compose up -d
# then open http://localhost:3000 and create the administrator