
Tabularia

Self-hosted, open-source visual data-preparation platform. A visual flow editor on pluggable engines: build a pipeline once, preview it on the whole dataset, and decide later where the compute runs.
The same flow scales from a laptop to a warehouse without being rewritten. Start
with nothing installed but Docker: transformations stream through memory in-process,
no cluster, no external service, no per-query bill. When the data outgrows one
machine, point the flow at DuckDB (same process, spilling to disk), a managed
ClickHouse, or Google BigQuery (serverless, nothing to operate) — the flow
definition does not change by a single node. The parquet stays in your bucket and the
warehouse reads it in place: nothing is copied, nothing streams back through the
workers. Storage follows the same curve, from MinIO on the same host to S3, Scaleway or
Google Cloud Storage; deployment from one docker compose up to Helm on Kubernetes.
Database sources and destinations, loops, charts, scheduling, cross-flow lineage, an AI assistant over your own catalog and an audit trail come in the box. On Kubernetes, your team also writes Python and R in governed environments and orchestrates its own containers, as steps of the same flows.
Tabularia takes its name from the Tabularium, the records office of ancient Rome — the place where the state's tables were kept in order.
Current release: 1.3.0 «Catone» — see CHANGELOG.md.
Part I · Business
The problem
Visual data-prep tools either cost thousands per seat, or quietly work on samples of your data and hope for the best. And once a pipeline exists, moving it to bigger iron usually means rebuilding it: the tool that was comfortable on a laptop does not speak to the warehouse the company already pays for.
Tabularia is an open-source alternative you host yourself: a visual, drag-and-drop pipeline builder that runs on the entire dataset, connects straight to your databases, keeps a full record of who did what — and lets the same flow run on five engines, from an in-process library to a serverless warehouse.
What you get
- Build pipelines visually — no code. Drag transformations onto a canvas, connect them, and preview the result at any step.
- No sampling, ever — unless you ask for it. Previews, profiles and charts run on the whole dataset through a streaming engine: what you see in the editor is what you ship. Where every read is billed, an optional development sample keeps the editor cheap, per node and switchable, and never touches production runs.
- Compute where it makes sense. The same flow runs on Polars, DuckDB, chDB, an external ClickHouse or BigQuery. Design in-process, then hand production to the warehouse: the parquet stays in your bucket, the warehouse reads it in place, nothing is copied and nothing streams through the workers. See Run it on your engine — or on your warehouse.
- Explore without building a flow. The Viewer is a read-only BI surface over any
datasource: filters, calculated fields, pivots and charts, computed on the whole
dataset by the engine you choose. Any configuration can be saved as a view into a
folder, next to flows and datasources. A view stores the configuration and never the
rows, so reopening it reads today's data — it is a lens, not a copy.
- Connect to your databases. Read directly from Postgres, MySQL, MariaDB,
ClickHouse, Trino, Oracle, Microsoft SQL Server and SharePoint (Excel and CSV); write results
back to a database table, on all of them, or publish
them as a reusable datasource. SQL Server's driver is Microsoft's, under Microsoft's
licence, so it is not in the published images: you add it to yours
(SQL Server). Files (CSV/Excel/JSON/parquet) work too, uploaded,
on an SFTP server or in an S3 bucket: a folder and a glob become one table,
refreshed on schedule, and a flow can drop its result there as a file (on SFTP the
server's host key is checked at every connection) (SFTP,
S3).
And any HTTP API (REST/JSON): page-number, offset, cursor and next-link pagination, OAuth2 client credentials too — the
credentials never leave the API's host (HTTP APIs). Inputs
and outputs share one placeholder language: dates that move by themselves
(
sales_{yesterday:yyyyMMdd}.csv,{last_refresh},{run_id}) in their own time zone, list variables and ranges (day = today-7 .. today step 1d: one file or one call per day, a missing day skipped and listed), refreshed as a snapshot or appended by key (placeholders).
- Connect to your databases. Read directly from Postgres, MySQL, MariaDB,
ClickHouse, Trino, Oracle, Microsoft SQL Server and SharePoint (Excel and CSV); write results
back to a database table, on all of them, or publish
them as a reusable datasource. SQL Server's driver is Microsoft's, under Microsoft's
licence, so it is not in the published images: you add it to yours
(SQL Server). Files (CSV/Excel/JSON/parquet) work too, uploaded,
on an SFTP server or in an S3 bucket: a folder and a glob become one table,
refreshed on schedule, and a flow can drop its result there as a file (on SFTP the
server's host key is checked at every connection) (SFTP,
S3).
And any HTTP API (REST/JSON): page-number, offset, cursor and next-link pagination, OAuth2 client credentials too — the
credentials never leave the API's host (HTTP APIs). Inputs
and outputs share one placeholder language: dates that move by themselves
(
- Ask your data. An optional AI assistant answers questions in plain language over the datasources you are allowed to read: it finds the table, reads the curated field descriptions, writes and runs the query on your engine, and shows the result table the numbers come from. Conversations are saved and can be reopened, so a question already answered is never paid for twice, and every turn shows what it cost. Any OpenAI-compatible endpoint works; an administrator decides which models may be used, and every query lands in the audit log.
- Nothing happens to your data that you cannot preview. Every node shows its row and column count as the preview arrives — no extra query, it is what the preview already returned — and edges can be removed with a click or the keyboard. Repeated previews reuse a per-step cache that is written after the answer is on screen, so a second click is fast without the first one waiting for it.
- Data contracts: bad data does not get published. A datasource can carry a contract — columns, types and rules on the values — checked every time new data arrives, before it is published. Each rule is either a warning (published, and reported) or an error (blocked: the datasource keeps serving the last good data and the run says which rule broke). The state shows as an icon wherever the datasource appears, down to the source nodes of the flows that read it; a change of state can send an email; the contract exports to the open ODCS format.
- Schedule and forget. Put flows on a schedule (timezone-aware, DST-safe) and let them refresh on their own; a load heatmap shows busy time-bands and collisions before they bite.
- Write R and Python in a governed environment. Administrators define the environments — language version, pinned packages, the groups that may use them, variables and secrets — and Tabularia builds the image. Every script runs as a Kubernetes Job in its own namespace, with CPU and memory limits, network policies and a timeout; scripts live in folders with their versions, Python is checked by Ruff as you type, and every run keeps its log. An optional assistant writes and fixes the code beside it without ever seeing a row of data (Python and R in flows).
- Orchestrate your containers. Run the images your team already ships — from Harbor, GitHub, GitLab, Docker Hub or your cloud's registry, limited to the repositories an administrator allows each group — with the command, arguments, variables, CPU and memory you set. A container gets its input as parquet and hands back its output, or just does its job elsewhere; retries, timeouts, logs and the outcome come with it (The Container node, Container registries).
- Chain the work. A flow group runs flows, datasource refreshes, saved scripts, container images and Pushmail emails (datasources sent as Excel files) in steps, drawn as a grid: the cells of a step run in parallel, the steps one after the other, and a failed step stops the chain. Build it by drag and drop, run it by hand or on a schedule, and watch every cell's state as it runs (Pushmail).
- Full history & governance. Every run is recorded with downloadable results; an audit log captures logins, flow runs, data exports and permission changes — "who entered, who ran what, which data was downloaded" — with a 24-hour access chart, and can be forwarded to Splunk as it happens, nothing skipped when Splunk is down.
- See how everything connects. A dedicated Lineage view maps datasources and flows across the whole workspace: provenance, impact/blast-radius, staleness and broken references at a glance. Optionally the same lineage is told to an external catalog in the OpenLineage standard (Marquez, DataHub, Astro…): every run becomes a job with the tables, queries, files and datasources it read and wrote, and a flow's dependencies can be exported without running it.
- Leave with your work. Any flow exports as a dbt project: one model per output,
the shared steps as
ref()-ed models,sources.yml,schema.ymlwith descriptions and the data contract as dbt tests, seeds for the files it reads. Run it on your ClickHouse, which reads the source databases live, with dbt-duckdb, or natively in the source database — as a complete project or as a folder for the data team's own project. End-to-end oracles run it with a real dbt and compare it with what Tabularia publishes. - Multi-user from day one. Password or SSO sign-in with any OIDC provider (Keycloak, Entra ID, Auth0, Okta…; verified against Keycloak) with sessions you can see and close, users & groups, nested projects with inherited view / edit / manage / connect permissions. Everyone works in the same place, safely.
- Connects to the rest of your stack. API tokens and service accounts let schedulers and CI run flows and read results; webhooks call your systems when a run finishes. Engine limits are tuned from the administration panel, without restarts.
- Yours to run. Self-hosted, AGPL-3.0 open source, no per-seat fees, no data leaving your infrastructure. Point it at managed S3 / Postgres / Redis if you prefer.
- Speaks your language, looks the part. UI in English, Italian, French, German, Spanish, with Dark, Light, Imperium, Dracula and Monokai themes, selectable per user.
Run it on your engine — or on your warehouse
Every flow is stored as a declarative list of operations, decoupled from execution. That is what makes the engine a deployment choice instead of a design constraint:
| Engine | Where the compute runs | What you need | How it is billed | Choose it when |
|---|---|---|---|---|
| Polars (default) | In the worker process | Nothing | Your servers | Day-to-day work, anything that fits the worker's memory |
| DuckDB | In the worker process, spilling to disk | Nothing | Your servers | Very large joins and aggregations on one machine |
| chDB | In the worker process (embedded ClickHouse) | The chDB build of the image | Your servers | Prototyping the ClickHouse dialect locally |
| ClickHouse (external) | On a managed or self-hosted ClickHouse server | A ClickHouse reachable from the workers | The server you rent | Big tables, sub-second aggregations, a warehouse you already run |
| Google BigQuery | On BigQuery, serverless | A GCP project and a bucket on Google Cloud Storage | Per byte read, no idle cost | Data already on GCP, elastic scale, zero servers to operate |
A flow carries two engines: the development one, used by the editor and manual runs, and an optional production one, used by the scheduler and "Run in production". Design on Polars with a development sample, schedule on ClickHouse or BigQuery: the flow does not change, and every run records the engine it actually ran on. An administrator can restrict which engines the installation allows.
The engines agree on one data standard — nulls, casts, joins, aggregates, sort order, pivots — locked by an oracle test suite that runs the same hand-computed expectations on all five. The remaining differences are documented, not discovered in production: docs/engines/engine-differences.md.
How far it scales, and what it costs to get there
The flow is a declarative list of operations; the engine is a runtime decision. That one property is what lets an installation grow without a migration:
| Stage | Compute | External services | Typical scale |
|---|---|---|---|
| Laptop / one server | Polars, streaming in the worker's memory | none | up to what the worker's RAM allows |
| One bigger machine | DuckDB, spilling to local disk | none | joins and aggregates past RAM |
| Your warehouse | Managed or self-hosted ClickHouse | a ClickHouse the workers can reach | tens of millions of rows, sub-second aggregates |
| Serverless | BigQuery | a GCP project and a GCS bucket | elastic, no idle cost |
Nothing above is a rewrite: it is a dropdown on the flow, and a flow can use one engine in the editor and another in production. Two mechanisms keep the growth honest:
- A development sample, off in production. Where every read is billed, an optional sample keeps the editor cheap. It is per source node, switchable, marked in the definition, and scheduled runs never sample — you cannot ship a sampled result by accident.
- A step cache with a ceiling. Repeated previews of the same chain reuse the
previous step instead of recomputing it. The copy is made after the preview has
answered, in a separate task, and steps above
CACHE__MAX_STEP_ROWSare not cached at all: a big intermediate result never makes you wait for a copy you did not ask for.
Managed ClickHouse
Set CLICKHOUSE_EXTERNAL__HOST and the engine appears in the picker. With the s3
transport the server reads and writes the parquet directly on the object storage
through its s3() table function: nothing passes through the workers, and an
aggregation over 25 million rows answers in 0.6 s instead of 18 s, because the parquet
is written with large row groups the server can skip. With the push transport
the worker stages the source in a table and streams the result back, which works with
any server that cannot see the bucket. Validated on Scaleway's managed ClickHouse;
ClickHouse Cloud speaks the same protocol and reads S3-compatible buckets the same way
(multi-replica services are not handled yet: query cancellation and the performance
page read one replica).
Optionally, datasets above a size threshold are copied once into a MergeTree on the server so the Viewer's full scans read local columns instead of the bucket.
Google BigQuery
Point the object storage at Google Cloud Storage, give the engine a project and a
service account, and every flow can run on BigQuery. Each source parquet becomes a
temporary external table of the query (gs://bucket/key), so no dataset is
loaded and no copy is made; the chain of operations is one GoogleSQL query; results
come back through the Storage Read API and are written as parquet like everywhere
else. Columns are checked with free dry runs; every job is capped by
BIGQUERY__MAXIMUM_BYTES_BILLED so a runaway query is refused before it runs.
The editor gets a native step-cache: intermediate steps are materialised as
expiring tables in a tabularia_cache dataset by a background task, so the first click
on a node never waits and the next ones read a small native table. Measured on a
25 M × 50 table with a 100 k development sample: 0.6–1.1 s per click with the cache,
1.1–2.9 s without.
Know the cost model before pointing the Viewer at a wide table: BigQuery bills the logical bytes of the columns a query touches, whatever the file compression. On that same 25 M × 50 table, aggregations read 100 MB–1 GB per query (a fraction of a cent); sorting whole rows reads all 50 columns, about 19 GB, eleven cents per click. The per-query cap and the development sample are the two guards; the free tier covers 1 TB a month.
Who it's for
Data & analytics teams that want a self-hosted, governed, no-sampling data-prep tool without enterprise licensing — and anyone who needs an auditable, multi-user pipeline builder that can start on one machine and grow onto the warehouse they already have.
Part II · Technical
Architecture
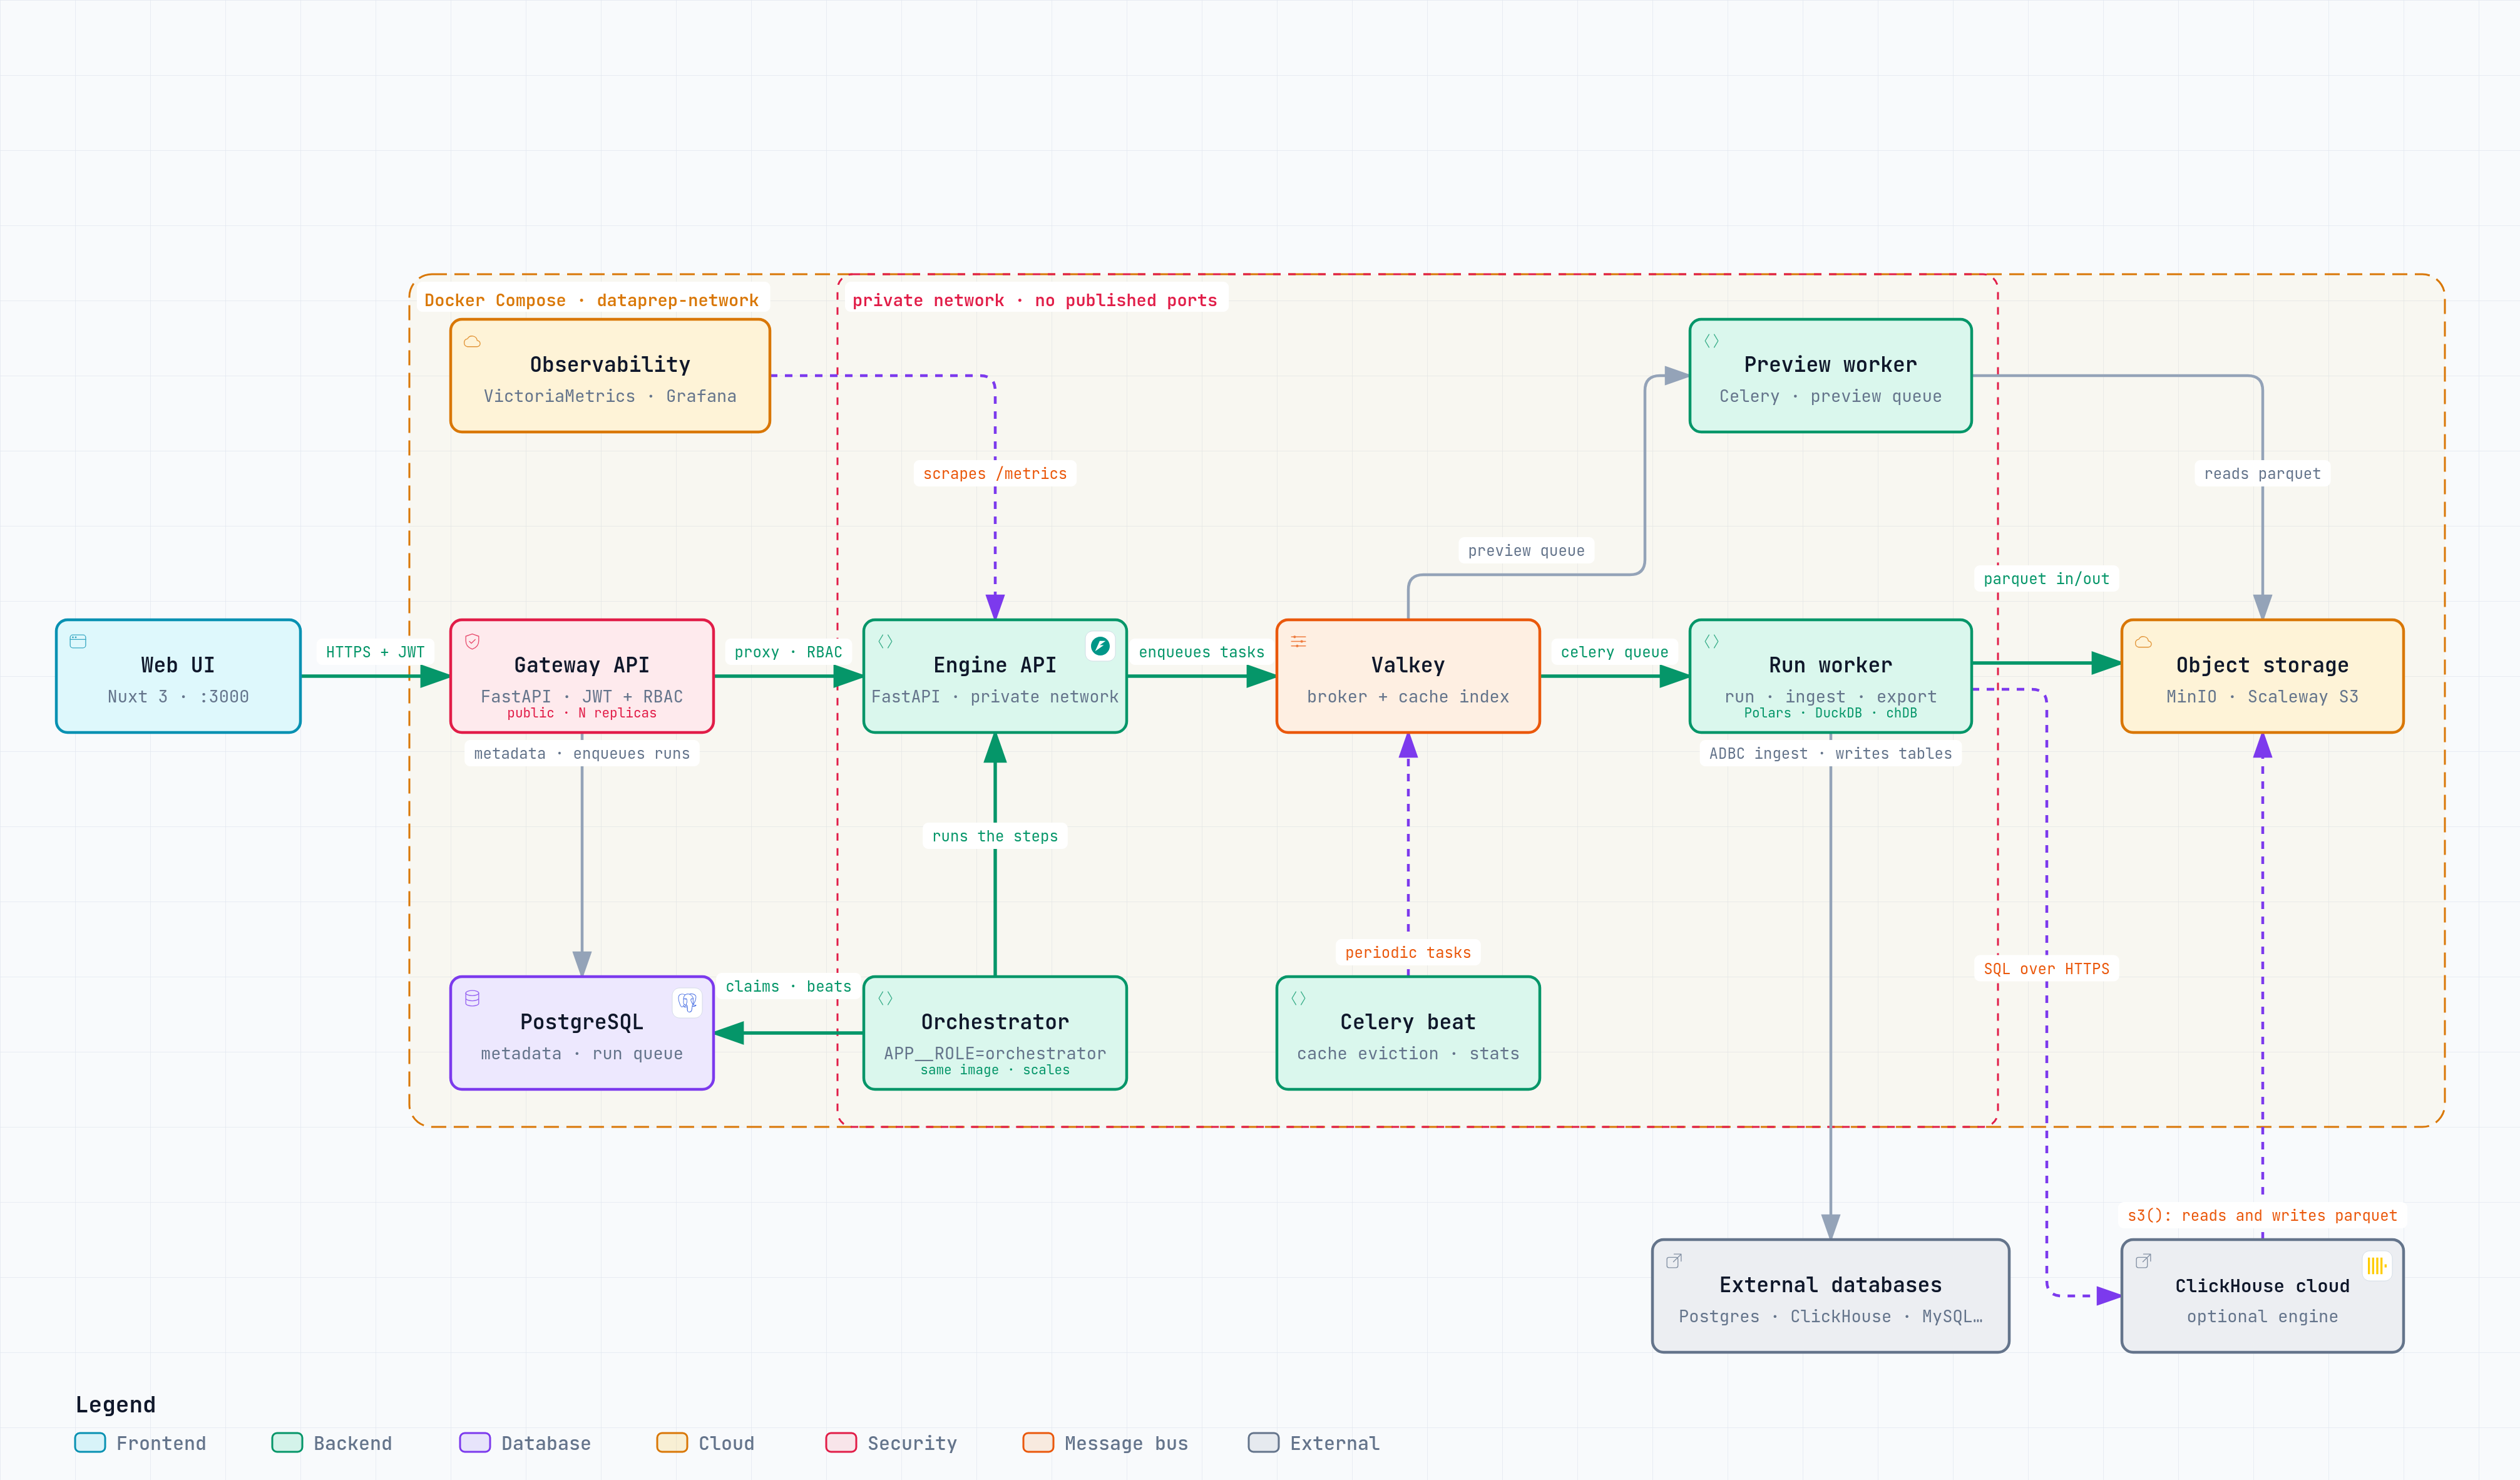
Open the interactive diagram
(pan/zoom, light/dark theme, search, guided views, PNG/SVG export). It is generated
with Archify from
docs/architecture/runtime.architecture.json;
every node cites the source files that implement it, verified against the commit
pinned in the spec.
| Runtime component | Role |
|---|---|
| Web UI | Nuxt 3 app, calls the gateway only (JWT) |
| Gateway | FastAPI control plane: auth, RBAC, audit; proxies to the engine after the permission check. Stateless between requests, so it runs in as many copies as you like (APP__ROLE=api) |
| Orchestrator | the same image in another role (APP__ROLE=orchestrator): fires the schedules and runs the flows. Each run is a row in Postgres that any orchestrator claims with a conditional update, so copies never fire a schedule twice. APP__ROLE=all (the default) does both jobs in one process |
| PostgreSQL | control-plane metadata (users, groups, projects, versioned flows, connections, runs, schedules, audit); its schema evolves through Alembic revisions (database migrations) |
| Engine API | FastAPI on the private network: turns every preview and run into a Celery task |
| Valkey | Celery broker, step-cache index, preview slots |
| Run worker / preview worker | Celery workers on two queues (celery: runs, DB ingest, export · preview: interactive previews); in-process engines (Polars, DuckDB, chDB) and the clients of the external ones |
| Celery beat | cache eviction and storage statistics |
| Object storage | one bucket, all parquet: datasets/ snapshots, cache/ steps, out/ results. MinIO locally; any S3 (Scaleway, AWS…) or Google Cloud Storage through its S3 API in the cloud |
| External engines (optional) | a managed ClickHouse reading and writing the parquet through s3(); Google BigQuery reading it as temporary external tables over GCS |
| External databases | sources streamed in Arrow batches into parquet snapshots (Postgres through ADBC, Oracle through python-oracledb in Thin mode, SQL Server through Microsoft's mssql-python, which you add to your image; no other vendor client), whole row groups whatever the driver's batch; Output nodes can write tables back |
| VictoriaMetrics + Grafana | scrape the engine /metrics, celery-exporter, cAdvisor and node-exporter |
The gateway (control plane) is the only public ingress: it owns the metadata Postgres and enforces auth + RBAC on every call before proxying to the internal engine (data plane), which stays stateless (Valkey + object storage only). Nothing that outlives a request lives in a gateway process — the run queue, the login throttle and "who has this flow open" are tables — which is what lets the API tier scale out and the orchestrator tier scale separately: one process at ~100 requests/s, three copies served 500 concurrent users at a 0.12 s p95 on one laptop.
That metadata Postgres has a diagram of its own:
Open the metadata database schema
— the 28 tables and 35 foreign keys of release 1.1.0, read back from a live database
rather than transcribed from the models, and generated with Archify from
docs/architecture/metadata-schema.architecture.json.
Six tables added since are not drawn yet: user_sessions, api_tokens, webhooks,
webhook_deliveries, engine_settings and siem_destinations (schema revisions
0002–0005, now 34 tables and 40 foreign keys).
Declarative IR & pluggable engines
Flows are stored as a declarative IR — a JSON list of typed operations — fully decoupled from execution. Adding or swapping an engine touches neither the routes, the workers, nor saved flows. Five engines are registered:
| Engine | id | Notes |
|---|---|---|
| Polars | polars | In-process, lazy, streaming. Default; full operation coverage. |
| DuckDB | duckdb | Out-of-core SQL (spills to disk) for very large joins/aggregations. Full operation coverage. |
| chDB (ClickHouse) | chdb | Out-of-core SQL with the ClickHouse dialect, embedded. Full coverage except foreach. |
| ClickHouse (external) | clickhouse | Optional. Same dialect and ops as chDB, executed on a remote ClickHouse server. Enabled by CLICKHOUSE_EXTERNAL__HOST. Transport s3 (the server reads/writes parquet directly on the object storage) or push (staging table + streamed result). |
| BigQuery | bigquery | Optional. GoogleSQL over temporary external tables on GCS; results through the Storage Read API. Enabled by BIGQUERY__PROJECT plus a service-account key. Full coverage except foreach and median inside pivot. |
Each engine is a registry of per-operation implementations. DuckDB and chDB are guarded imports — absent packages simply mark the engine unavailable without breaking Polars; the external engines are listed but unavailable until configured. chDB is fork-unsafe, so it is imported lazily inside the Celery child (never in the prefork parent) to avoid inherited native-thread deadlocks. Users pick a preferred engine in settings (default for the Viewer and new flows); each flow persists the engine it was built with, so opening a non-preferred flow is regression-safe. Each flow also carries an optional production engine: the editor (previews, manual runs) uses the development engine, while scheduled runs and "Run in production" use the production engine. Every run records the engine it actually ran on.
An administrator can narrow that choice for the whole installation. Admin → Engines decides which engines a flow may be built on. Disabling an engine stops it from being chosen — at creation, when changing a flow's engine, and as a production engine — but deliberately does not stop the flows already using it: a switch in an admin panel should never halt a scheduled DAG the moment it is pressed. The panel reports how many flows still run on each engine — that list is the migration backlog. At least one engine always stays allowed, and the picker keeps not allowed here apart from not configured.
External engines in detail
ClickHouse (external) — CLICKHOUSE_EXTERNAL__HOST, __PORT (8443 with TLS on
managed services), __USERNAME, __PASSWORD, __DATABASE, __SECURE, __TRANSPORT
(s3 | push), __S3_ENDPOINT (the storage endpoint as the server sees it) and,
recommended, __S3_NAMED_COLLECTION: a named collection holding the bucket credentials
on the server, so keys never travel inside a query nor land in query_log. The engine
raises max_threads on scan-heavy queries to hide object-storage latency, never on
LIMIT queries; __MATERIALIZE_MIN_ROWS turns on the MergeTree copy for the Viewer.
Interactive previews carry a log_comment tag: when a newer preview supersedes one
still running, the server is told to KILL it. Preview timings and the server's own
query_log are shown on the admin Performance page.
BigQuery — BIGQUERY__PROJECT, BIGQUERY__CREDENTIALS_FILE (path of the
service-account JSON key inside the container) or BIGQUERY__CREDENTIALS_B64 (the
same key, base64 on one line), BIGQUERY__LOCATION (empty = the bucket's region),
BIGQUERY__MAXIMUM_BYTES_BILLED (default 20 GiB) and BIGQUERY__CACHE_DATASET
(default tabularia_cache, empty disables the step-cache). The service account needs
BigQuery Job User on the project, BigQuery Data Editor for the cache dataset, and
read access on the bucket; the object storage must be Google Cloud Storage
(STORAGE__ENDPOINT=https://storage.googleapis.com with HMAC keys). Column names
BigQuery cannot represent (Ragione Sociale, Importo (€)) are mapped to safe names
inside the query and restored in the results; compute expressions are transpiled from
the common dialect with sqlglot (% → MOD, strftime → FORMAT_DATE). Jobs are
labelled with the preview tag so a superseded preview is cancelled on the service.
Verified against a real project: the cross-engine oracle suite passes on BigQuery
(BIGQUERY_LIVE=1 pytest -k bigquery).
Operations
~18 transforms plus source / output / control nodes, all engine-agnostic in the IR:
select · drop · rename · cast · compute · sql · filter · sort · limit · unique · fill_null · drop_nulls · group_by · pivot · unpivot · join · union · foreach
foreachis a loop container: it iterates its body over a driver table with{{placeholder}}substitution, appending results with bounded memory.- Upstream filters per source node: AND-ed
{column, operator, value}conditions set in the editor on the input datasource and saved with the flow. They become plainfilteroperations injected right after the source is read, before anything else (development sample included), in every mode — editor previews, scheduled runs, "Run in production" and the dbt export — so a flow can read only the slice it needs from a large table. - Cross-engine data standard. The same flow must give the same data on every engine,
so the engines follow one explicit semantics, SQL-like, locked by an oracle test suite
(
backend/tests/test_data_correctness.py, hand-computed expectations run on Polars, DuckDB, chDB, external ClickHouse and BigQuery): comparisons with NULL are false (ne/not_indrop NULLs); aggregates ignore NULLs,count/n_uniquenever count NULL,sum/mean/min/maxof an all-NULL group are NULL,std/varare sample (n-1),medianinterpolates; sort puts NULLs last in both directions; failed casts give NULL (never an error), text is trimmed before parsing, text→int accepts integer literals only, number→int truncates; joins never match NULL keys,onkeys are one coalesced column,left_on/right_onkeep both key columns, a non-key homonym from the right gets_right;computeoverwrites an existing column in place; integer sums are int64; datetimes are naive UTC instants everywhere. The differences that remain between engines are listed in engine-differences. - Development sampling per source node: "first N rows" or "random p%" set in the
editor and saved with the flow. It only affects previews and editor runs: the gateway
resolver injects it solely in development, never for scheduled runs or "Run in
production", and strips any such marked operation from production launches as defence
in depth. With
PREVIEW__DEFAULT_SAMPLE_ROWSset, every source node without a sample of its own gets an automatic "first N rows" sample, shown as a badge on the node and switchable per node ("off (all rows)") — the right default where every read is billed. Sample only the big table: joining two sampled sources loses most matches. - Field descriptions on datasources: a hand-curated
{column: text}map, kept separately from the inferred schema so it survives refreshes. pivot/unpivotfollow one cross-engine standard: pivot columns are named by the value as text (nullfor NULL,2024_webfor multi-column keys, existing combinations only, text-ordered), missing or all-NULL groups are NULL (count/n_unique→ 0), and unpivot keeps only the index columns with the value cast to the common supertype.sqlruns engine-native SQL against the node input (FROM input), with a guardrail floor that blocks filesystem / URL / executable access.- Nodes:
source(any datasource: an uploaded file, a database table or query, an SFTP or S3 folder, a SharePoint path, an HTTP API call),output(write to a DB table, publish a datasource — optionally with a copy on an external S3 bucket, see Publishing to an external bucket —, drop a file on an SFTP server or an S3 bucket, or send it by email; append/replace + post-SQL for tables; names built with placeholders),scriptandcontainer(code and images run as Kubernetes Jobs). Refreshing datasources and running other flows in order is the job of a flow group (steps of flows, refreshes, scripts, images and Pushmail emails); therefreshandrunflownodes of flows saved before still run, but are no longer offered.
Every node's output is content-addressed and cached: editing the last step of a
10-step flow recomputes one step, not ten. The copy is written after the preview
answers, by a separate task, and only for steps up to CACHE__MAX_STEP_ROWS (1M by
default): a step as large as the source is recomputed from the original parquet
instead of being copied. In-process engines and ClickHouse keep the steps as parquet
under cache/; BigQuery keeps them as expiring native tables. Cache entries evict by
TTL.
Storage layout
All parquet, on any S3-compatible object storage (MinIO by default) or on Google Cloud Storage through its S3 API — the two things GCS does differently (no batch delete, no chunked request checksums) are handled by the storage layer:
raw/       ingested files, as uploaded
datasets/  normalized parquet datasources
cache/     content-addressed step outputs
out/       run results, downloadable as CSV/Excel
Parquet files are written with large row groups (INGEST__PARQUET_ROW_GROUP_ROWS,
default 1 M) and, when a datasource declares sort keys, ordered on them: that is what
lets an external engine skip most of a file on a filtered query instead of reading it.
Publishing to an external bucket
An Output node that publishes a datasource can also drop a copy of the same parquet on a bucket Tabularia doesn't own — the one another team already reads from. It is the integration path for the common case where nobody wants a data-prep tool writing into their database, and it needs no orchestrator: the consumer polls a path.
By default the copy lands at the same key, always parquet, overwritten on every run,
so whoever reads it agrees on one path once and never has to discover a new filename.
The key may also carry placeholders — one object per
day with exports/sales/{today:yyyy/MM/dd}.parquet, resolved in the node's time zone.
Scheduled runs, «Run now» and runs started from the editor all write it.
The overwrite is a single object and becomes visible only when the upload completes:
a reader gets either the previous file or the new one in full, never a mixture.
It is best effort by design. The datasource is the result; the copy is a delivery downstream of it. A copy that fails — or cannot be made, like a key whose placeholder is wrong — leaves the run successful and the datasource published, and the error is recorded on the run and returned by the API.
No screen shows that error yet. Until that is wired up, treat a successful run as saying nothing either way about the copy.
Use a different bucket from the one Tabularia itself runs on. A copy written into that bucket is not checked against the objects already there: aim it at a key another datasource is using and you overwrite that datasource's snapshot, outside the permission model.
Dynamic inputs and outputs
Every name Tabularia builds — the folder and files a datasource reads, the call an API
datasource makes, the file, key or email an Output writes — speaks one placeholder
language: dates that move by themselves, formatted the way the other side wants them,
in a time zone of your choice. Nothing is evaluated as code; a wrong placeholder is
refused when you save, and every form previews the resolved value as you type
(«today: sales_17102026.csv»). The full reference is in
docs/placeholders.md.
| Write | Get (on 18 October 2026) |
|---|---|
{today} · {yesterday} · {today-7} · {today-1m} | 2026-10-18 · 2026-10-17 · 2026-10-11 · 2026-09-18 |
{start_of_month} · {start_of_week} · {now-2h} | 2026-10-01 · 2026-10-12 · two hours ago, a date-time |
{yesterday:ddMMyyyy} · {today:yyyy/MM/dd} · {now:yyyy-MM-dd'T'HH:mm} | 17102026 · 2026/10/18 · 2026-10-18T09:30 |
{today:%Y%m%d} · {now:epoch} · {now:epoch_ms} | strftime, and seconds or milliseconds since 1970 |
{last_refresh} | inputs: when the last successful refresh started (to fetch only what is new) |
{run_id} · {flow} | outputs: the run's number and the flow's name |
Inputs. A daily file on SFTP: folder /in/{today:yyyy}/{today:MM}, files
sales_{yesterday:ddMMyyyy}.csv. A list variable makes one read or call per value —
symbol = AAPL, MSFT, ENI.MI with the path /quotes/{symbol} — and every row says which
value it came from (_param_symbol). A range variable does the same over time:
day = today-7 .. today step 1d          # the 7 days before today (today excluded)
files: exports/{day:yyyy/MM/dd}/*.parquet
reads one folder per day, stacks them with _file and _param_day, skips and lists a
day with no file, and fails only when the whole range has none. On an API the same range
makes one call per window, with {day} and {day_end} for APIs that take a from/to and
cap how many days one call may cover (step 7d over a year = 53 calls). Combined with
append by key — rows whose key already exists are replaced, new keys added — it is
the classic nightly incremental import: «every night re-read the last three days».
Outputs. An SFTP folder /out/{today:yyyy}/{today:MM} and file
report_{today:yyyyMMdd}_{run_id} write report_20261018_381.csv; an S3 key
exports/{flow}/{now:yyyy-MM-dd'T'HHmm}.parquet in Europe/Rome; an email with subject
Daily sales {yesterday:dd/MM/yyyy} and attachment sales_{yesterday:yyyyMMdd}. A
resolved name can never leave its folder (.., a / coming from a value, control
characters and over-long names are refused), and outputs written before this language
existed keep their exact names: {date}, {datetime}, {run_id} and {flow} mean what
they always meant, and literal braces stored earlier were escaped by a migration.
Auth, RBAC & audit
Administrators are granted in two ways: a personal flag, or membership of a group marked as an administrators group — every member is an administrator for as long as they belong to it, which also means the right can be granted from an identity provider through SSO group mapping. Both paths are audited, and no administrator can remove their own last route to administration: demoting or deactivating yourself, demoting or deleting your only admin group, or leaving it, is refused rather than silently performed.
- Sessions that can be closed: every sign-in (password or SSO) is a row the
gateway checks on each request, in the same query as the user. The browser keeps it
in an
HttpOnlycookie no script can read; sign-out really ends it; people see and close their own sessions, administrators anyone's from the Audit page; a password change or a disabled account closes them; an optional idle timeout (AUTH__SESSION_IDLE_MINUTES) signs an unattended page out after a warning. - An API for integrations (docs/api.md): personal API tokens and service accounts for schedulers and CI, read-only or read-write, always expiring, revocable, recorded in the audit log; webhooks that call another system when a flow or a datasource refresh finishes, signed with HMAC and retried.
- Settings from the panel (docs/engine-settings.md): administrators change about a hundred settings of the gateway, the Kubernetes features and the engine (limits, waits, retention, the assistant's budget, the caps of the data sources) from Administration → Settings, in a box per component. Most apply within seconds on every process; the ones read only at start are marked, and the panel restarts their pods one at a time on Kubernetes. Addresses, credentials and the switches tied to the cluster stay in the environment; every change is checked and audited.
- Audit log to Splunk (docs/siem-splunk.md): every audit entry forwarded to the Splunk HTTP Event Collector within seconds, nothing skipped when Splunk is down, configured and tested from Administration → SIEM.
- RBAC: users & groups, nested projects, inherited view / edit / manage /
connect permissions; access resolves to a set of
readable_project_idsapplied on every query. Object-level permissions extend to connections and datasources on the data plane. - Audit log: append-only, with text snapshots that survive rename/delete. Captures logins, CRUD, flow runs, data exports, and permission changes; admin tab with a 24-hour access-activity chart. Secrets (DB passwords) are encrypted at rest (Fernet).
- SSO / OIDC (optional): sign in against Keycloak, Microsoft Entra ID (MSAL),
Auth0 or Okta with the authorization-code flow (PKCE,
state,nonce, id_token validated against the IdP JWKS). Users are provisioned on first login and the IdP'sgroupsclaim is reconciled onto Tabularia groups by name. Off untilOIDC__ISSUERis set; local login always stays available as break-glass. Seedocs/design/sso-group-mapping.mdand the runnable Keycloak example indocs/examples/keycloak/.
Free-form SQL, contained
A flow can carry a node holding hand-written SQL, and the assistant writes one for
every question. That node is bound to a single rule: it may read its own input and
nothing else. The query is parsed, and anything in a FROM or JOIN position that
is not self / input (or a WITH defined in the same query) is refused — table
functions, another database's tables, information_schema, dictionary and settings
lookups included. A query that cannot be parsed is refused rather than run. On DuckDB
the node executes in a locked in-memory sandbox with external access disabled; Polars
only ever sees the registered frame.
This matters because the engine holds credentials that can read the whole bucket: if a query could name another table, the permission on a datasource would be decorative.
AI assistant
Optional, in the gateway, built with pydantic-ai, against the
providers an administrator adds from the panel: Anthropic through its own SDK, and any
OpenAI-compatible endpoint (also from AI__BASE_URL, AI__SECRET_KEY; verified on Scaleway
Generative APIs). The agent has three tools and nothing else: list_datasources,
describe_datasource (columns, types and the hand-written field descriptions — the
semantic context that makes the query right — plus a few sample rows) and
query_datasource (one read-only SELECT … FROM self, executed by the engine through
the same sql node and guardrails as the editor, rows capped by
AI__MAX_RESULT_ROWS). Every tool re-checks the caller's permissions: a datasource
outside the user's VIEW scope looks exactly like one that does not exist. Each query is
an audit event (ai.query, with the SQL, the model and the row count).
Conversations are saved in the gateway's database, private to their author and
deleted with the account. They can be searched by title, reopened with their steps and
result tables, and continued — a question already answered costs nothing to read again.
The assistant names each conversation itself from the first question. Because the
history lives on the server, the browser sends only a conversation id: it cannot forge
a history, and a turn is bounded by AI__MAX_COST_PER_TURN_USD and
AI__MAX_INPUT_TOKENS_PER_TURN, not merely by a number of model round-trips.
What a call cost is on screen, under each answer and for the conversation as a whole. The figure comes from the price data shipped with pydantic-ai — there is no price list of ours to go stale — and it is an estimate from the model's list price, not your provider's invoice; a dash means that model could not be priced, which is not the same as free.
While the assistant works, the page names the phase it is actually in — scanning the catalog, reading the fields of a datasource, querying it, writing the answer — read from the same stream events the steps are read from.
Models are an administrator's decision (Admin → AI models): the provider's catalog is listed, nothing is enabled by default, and embedding or audio models cannot be enabled for chat.
People always know they are talking to an AI (EU AI Act, article 50). Before the first question a dialog says so, and it cannot be skipped. In both assistants every answer is labelled AI assistant with the model that wrote it, every question as the user's, also for screen readers. A notice that stays under the input reads "This is an AI: it can make mistakes. Always check the results". A downloaded conversation opens with the same notice and labels who wrote what.
On the external ClickHouse engine the assistant's queries can run as a dedicated
read-only account (CLICKHOUSE_EXTERNAL__AI_USERNAME): a second barrier behind the
SQL node's allow-list, with no access to system, to any table, or to url() and
file(). See docs/engines/clickhouse-ai-user.md.
In the flow editor
The editor's right panel has a second tab, Assistant, that builds the flow on the canvas with you: ask for "the orders of last year, total per country" and it puts the datasource on the canvas, adds a filter and a group-by, and checks every step on a preview of the data — a step that fails or returns the wrong columns is fixed before it goes on. It places the same operations you would, with the same parameters the node panel shows; it reads only the datasources you may read, and previews pass the checks the editor's do. What it built comes back as a whole and is applied as one Undo step; it never saves, runs or schedules the flow. If you change the canvas while it works, its version is not applied over yours without asking. The conversation is kept with the flow and reopens with it; spending caps and the audit log count it like the data assistant's.
In the script editor
Beside the code of a Script node or a saved script, Assistant writes and fixes Python and R for the script's environment, and «Explain and fix the last error» starts from a failed run. It proposes whole files, applied only when you say so, as one change you can undo. No data reaches the model: the code, the environment and its packages, the names of the variables and of the inputs' columns, and only the error of a failed run's log, never what the script printed. See docs/scripting.md.
Scheduling & timezone
Cron-style schedules are evaluated in a deployment-wide timezone (APP__TIMEZONE,
DST-aware) and stored/returned in UTC; the frontend displays browser-local time. A
schedule-load heatmap surfaces busy bands and collisions against a configurable
worker capacity. Schedules fire from the orchestrator role: a due slot is taken with
a compare-and-swap on the time the process saw, so with several orchestrators exactly
one fires it; a flow whose last run failed on schedule sends an email, once, to the
addresses set next to the schedule.
A flow group is queued and claimed like a flow's run. Its cells start together,
each flow under its own run row, so the flow's schedule cannot start it twice while
the group runs it. A flow already running is never duplicated: its run counts for the
cell when it runs in production and started after the previous step, otherwise the
cell runs the flow once it ends. A saved script's cell takes the script's live slot the
same way; a container cell runs its image as a Container node with no edges; a
Pushmail cell sends one email with an .xlsx per datasource, its recipients within the
SMTP connection's allowed domains, checked again when it runs. Cells
count in ORCHESTRATOR__MAX_CONCURRENT like flow runs; within that, how many really
run at once is up to the workers and the queue.
Export to dbt
A flow is not locked in the tool: from the Flows page, Export turns it into a dbt
project (administrators only — an admin group is the way to give it to the data team). One model per output node (table, or incremental in append for database
tables written in append), the steps shared by several outputs as ephemeral models
referenced with ref(), sources.yml with the tables, their descriptions and columns,
schema.yml with every model's columns and descriptions and the data contract as dbt
tests (not_null as a generic test on the column; a one-column unique — two NULLs are
a duplicate, as in Tabularia — accepted_values, range, pattern, row count and expressions
as singular tests, each with the contract's severity), a seed for every file the flow
reads, a SQL-query datasource as an ephemeral model, and, from an upstream flow whose
output the flow reads, only the branch that publishes it. Three targets: ClickHouse
(dbt-clickhouse on your ClickHouse, which reads Postgres, MySQL and MariaDB live through
its PostgreSQL and MySQL table engines), dbt-duckdb, which attaches the source
databases and runs the very SQL Tabularia runs, and the native warehouse
(dbt-postgres or dbt-clickhouse, with the SQL translated by sqlglot; MySQL and MariaDB
sources are read by the other two targets). A dialog shapes it for the data team: a complete
project or a folder to copy into theirs, names and prefix, layers, their source names,
schema, materializations, tests and emails. End-to-end oracles export every Sample flow,
run it with a real dbt and compare it with the datasource Tabularia publishes
(e2e/dbt_export). The details, the mapping and the limits are in
docs/dbt-export.md.
OpenLineage (optional)
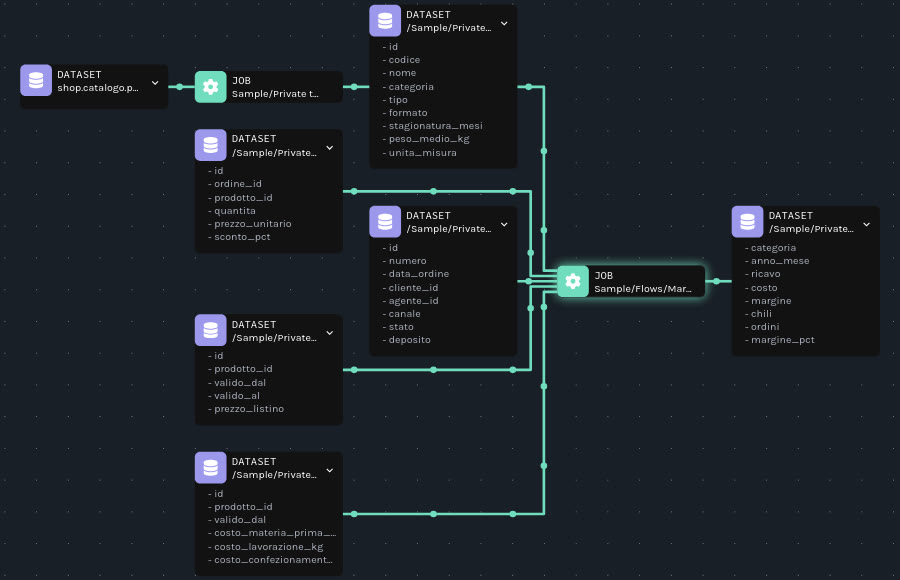
Set OPENLINEAGE__URL (and OPENLINEAGE__API_KEY if the collector wants one) and
every run that closes is reported with the official OpenLineage client: a flow run is
a job named after its folder path, its output nodes are child jobs with a
ParentRunFacet, a datasource refresh is a job of its own. Inputs are the datasources
read — named as in Tabularia under their folder path (tabularia://<namespace> +
/Folder/name), with schema and snapshot version, the parquet they serve as a symlink
and the Tabularia id in a tabularia facet
(schema) — database tables
(postgres://host:5432 · db.schema.table, the standard naming), the tables a SQL
query reads (extracted with sqlglot, the query itself in the sql facet) and
SharePoint files; outputs are the datasources published, the tables written, the
S3/GCS objects and mirror copies. Emails are not datasets. Only metadata leaves: names,
schemas, query texts, paths, counts and times — never rows, users or credentials.
Events leave after the commit that closes the run, through a bounded queue and a
background thread: a collector that is down or slow never fails or delays a run.
Measured: closing a run costs 5–15 ms once, and under a storm of runs the gateway's
throughput is the same with lineage on or off, whether the collector is fast or
answers in 2 seconds.
OPENLINEAGE__FILE writes the same events as JSON Lines instead of, or
besides, the HTTP collector; the library's own OPENLINEAGE_URL / OPENLINEAGE_CONFIG
work too, for composite and custom transports.
GET /flows/{id}/openlineage returns the flow's dependencies as a static JobEvent
built from its definition — to download (also from the Flows page, under Export), or
to POST to the collector so that a catalog knows the flows before they ever run.
The full mapping, the dataset naming and the collector set-ups are in
docs/openlineage.md.
Monitoring
Ships in the box: VictoriaMetrics + Grafana dashboards (task durations, cache hit rate, storage growth, per-container memory, preview latency by engine), plus cAdvisor, node-exporter and a celery-exporter. Grafana is embedded in an admin-only Monitoring tab, and a Performance page shows run durations, preview histograms per engine and the external ClickHouse's slowest queries without any extra table.
Services (docker-compose)
| Service | Role |
|---|---|
frontend | Nuxt 3 app (SSR) — http://localhost:3000 |
gateway | FastAPI control plane (auth, RBAC, audit) in role all: it also fires schedules and runs flows. Split it into api and orchestrator copies when you scale (see docs/deploy/kubernetes.md) — :8000 |
backend | FastAPI engine (preview) |
worker / preview-worker | Celery workers (runs, DB ingest / preview) |
beat | Celery beat: the only clock of the periodic tasks; keep it at one copy |
keys-init | gives the keys volume (the encryption key) to the services, then exits |
postgres | control-plane metadata |
redis | Valkey — broker, cache index, counters |
minio | S3 object storage — console :9001, S3 API :9002 |
victoriametrics / grafana | metrics + dashboards — :3001 |
cadvisor / node-exporter / celery-exporter | metric exporters |
sampledb-postgres / sampledb-clickhouse / sampledb-init | the sample ERP and CRM (:5434, :8124) and the container that builds the Sample folder, then exits |
Quickstart
Production on Kubernetes: see
docs/deploy/kubernetes.mdfor the components, the hardened backend image, ingress and storage sizing, and the Helm chart ininfrastructure/helm/tabularia. Upgrading:docs/deploy/release-checklist.md.
Requires Docker and Docker Compose. Step by step, with the sample data and a first scheduled flow: getting started with Docker Compose.
git clone https://github.com/JumpAsAService/Tabularia.git
cd Tabularia/infrastructure
docker compose up -d
Nothing to configure: open http://localhost:3000 and create the administrator (the page
asks for it only while the installation has no account). The sample data, a company
with an ERP and a CRM and eleven ready-made flows, appears a couple of minutes later.
The first docker compose up -d builds the images from the code: 2–3 minutes on a fast
machine, 5–15 on a laptop. Settings are optional: cp .env.example .env and edit.
Script and Container nodes, saved scripts, container registries and the automatic
database backups need Kubernetes: on this stack they are shown greyed out (Python and R in flows,
The Container node).
| Service | URL | Credentials |
|---|---|---|
| App | http://localhost:3000 | the administrator you create at the first visit |
| Gateway | http://localhost:8000 | through the app's sign-in, or an API token |
| Grafana | http://localhost:3001 | admin / admin |
| MinIO | http://localhost:9001 | minioadmin / minioadmin |
Upload a CSV/XLSX/JSON/parquet file or connect a database, drag transformations from the sidebar, connect nodes, preview at any point, then run — or download any node's data as CSV/Excel.
Adding an external engine is configuration only. For a managed ClickHouse:
CLICKHOUSE_EXTERNAL__HOST=xxxx.datawarehouse.it-mil.scw.eu
CLICKHOUSE_EXTERNAL__PORT=8443
CLICKHOUSE_EXTERNAL__SECURE=true
CLICKHOUSE_EXTERNAL__USERNAME=...
CLICKHOUSE_EXTERNAL__PASSWORD=...
CLICKHOUSE_EXTERNAL__S3_ENDPOINT=https://s3.it-mil.scw.cloud   # the bucket as the server sees it
For BigQuery, with the bucket on Google Cloud Storage:
STORAGE__ENDPOINT=https://storage.googleapis.com               # HMAC keys in STORAGE__ACCESS_KEY / SECRET_KEY
STORAGE__REGION=auto
BIGQUERY__PROJECT=my-gcp-project
BIGQUERY__CREDENTIALS_B64=...                                  # base64 -w0 service-account.json, one line
PREVIEW__DEFAULT_SAMPLE_ROWS=100000                             # keep the editor cheap
Recreate the workers (docker compose up -d) and the engine shows up in the picker;
docs/configuration.md lists every variable, with its default.
Secrets: SECURITY__FERNET_KEY encrypts the connection passwords, the same value in
gateway, engine and workers; they refuse to start with an invalid one, or with none
unless a SECURITY__KEYS_DIR is shared, where it is created at the first start (the
Compose stack of infrastructure/ does that, in its keys volume: back it up with the
data). On Kubernetes the chart sets the key. With
APP__ENV_NAME=production the gateway additionally refuses the dev-default secrets
(JWT__SECRET, admin and DB passwords) until they are overridden. Storage, broker,
database, timezone and engines are all env-driven — pointing at managed services is a
config change, not a code change.
Database schema: the metadata schema is versioned with Alembic revisions in
gateway/app/db/migrations/versions/. The
development compose migrates at startup (DB__AUTO_MIGRATE=true). Everywhere else the
migration is a step of its own, python -m app.db.migra, run before the new version
starts (the Helm chart does it in an init container): it applies the revisions in one
transaction and checks the result against the models, and a gateway refuses to start on
a database behind its code. Revisions go forward only and keep the previous version
working during a rolling update; an installation from before Alembic is adopted by the
first run. How to add a revision: docs/database-migrations.md.
Upgrading an installation on Kubernetes or minikube (backup, rollout, rollback, restore):
docs/deploy/upgrading.md.
Sample data
A realistic cured-meats company dataset, on by default in the Compose stack — an ERP on Postgres and a CRM
on ClickHouse, generated with Faker/numpy — plus an init container that builds a
ready-made Sample folder in Tabularia on top of it. The data ships built-in
seasonality (monthly volume, product & channel seasonal mix, per-warehouse
fulfilment anomalies) so pivots tell a story. Details in
infrastructure/sampledb/README.md.
It is on in the Compose stack of infrastructure/, at the small scale (SAMPLES_SCALE
in .env: small | medium | robusta). To leave it out:
docker compose up -d --scale sampledb-init=0 --scale sampledb-postgres=0 --scale sampledb-clickhouse=0
The sampledb-init container waits for the gateway and the two sample databases,
fills them if they are empty (seconds at small, longer at robusta), then logs in
as the administrator and creates, idempotently by name:
| Where | What |
|---|---|
Sample | the two connections (ERP, CRM) and four saved views (reports) |
Sample / Flows | eleven flows — margin by category, cost to serve, RFM segments, CRM workload, leaderboards, private ⋈ public joins — three of them scheduled |
Sample / Private tables | the nine company tables, and the tables the flows produce |
Sample / Public tables | reference tables anyone could publish: a calendar with Italian holidays, the twenty regions |
Some tables carry column descriptions and some deliberately do not, so the
difference an assistant-ready datasource makes is visible. The flows are run once
so their output tables exist and the reports have something to show
(SAMPLES_RUN_FLOWS=false skips that). The folder is created with no permissions
on it: who gets to see it is the administrator's call, like any other folder.
Restarting the stack does not duplicate anything: the container finds what it made and stops.
Internationalization & themes
UI copy lives in per-language i18n catalogs (en, it, fr, de, es), selected
per user and persisted via cookie for SSR safety. Themes (dark, light, imperium,
dracula, monokai) are CSS-variable palettes on :root[data-theme], persisted in localStorage
with an anti-flash head script. Code and comments are English-only; end-user strings
are translated.
License
Copyright © 2025–2026 Leonardo Trivelli.
Licensed under the GNU Affero General Public License v3.0 — see LICENSE.
For commercial licensing options, contact the author. The notices of the third-party software
are in the app, under Open source licences in the settings menu. If you offer a changed
version to others over a network, the AGPL asks you to offer them its source: point
NUXT_PUBLIC_SOURCE_URL (Helm: frontend.publicSourceUrl) at it, and Source code in the
menu leads there.
Tabularia is provided "as is", without warranty of any kind; the authors are not liable for any damage, including loss of data (AGPL-3.0, sections 15–16). Keep backups — and take one before every upgrade: database migrations only go forward.
"BigQuery" and "Google Cloud" are trademarks of Google LLC; "ClickHouse" is a trademark of ClickHouse, Inc. Other product and company names mentioned here are trademarks of their respective owners, named only to say what Tabularia works with; Tabularia is not affiliated with, endorsed by or sponsored by any of them.
Third-party services
The default docker-compose deployment includes MinIO (AGPL-3.0) and Grafana (AGPL-3.0) as separate, unmodified services accessed over standard APIs (S3, HTTP). They are deployment choices, swappable via environment variables. All libraries used by Tabularia itself are under permissive licenses (MIT/BSD/Apache-2.0/ISC).