Audit log to Splunk
Administration → SIEM sends every entry of the audit log to Splunk through the HTTP Event Collector (HEC), within about fifteen seconds, for the security team and whoever runs Tabularia. Application logs and metrics are not part of it: those are collected at the infrastructure level (Universal Forwarder, the Docker logging driver; see Monitoring). The other integrations are listed in Integrations.
In Splunk
- Settings → Indexes → New Index: a dedicated index, for example
tabularia. - Settings → Data inputs → HTTP Event Collector → New Token:
- source type
tabularia:audit, or leave it to Tabularia, which sets it on every event; - Allowed indexes: only the index above. This matters. With a token that may write anywhere, an event sent to a misspelled index is accepted and then dropped by Splunk, so it is lost while Tabularia counts it as delivered. A token limited to its index refuses it instead, and the error shows in Tabularia.
- source type
- Note the HEC address. It is usually
https://<splunk>:8088. The token is the value Splunk shows once.
Indexer acknowledgment (useACK) can be on or off: Tabularia sends a channel on
every request.
In Tabularia
Administration → SIEM, as an administrator:
| Field | |
|---|---|
| HTTP Event Collector address | the base is enough (https://splunk.example.com:8088). The /services/collector/event path is added; a full path, or a proxy's own path, is kept as is |
| HEC token | stored encrypted (Fernet), never shown again |
| Index | empty = the token's default index |
| Sourcetype / Source / Host | default tabularia:audit / tabularia / tabularia. Use Host to tell installations apart |
| Verify Splunk's certificate | on by default (see below) |
Send a test event sends one event immediately and shows Splunk's answer: a wrong
token, a refused index, a certificate problem or an unreachable address show up
here. Find the event in Splunk with sourcetype="tabularia:audit" action=siem.test.
Then Turn forwarding on.
The first time forwarding is turned on, it starts from that moment; the earlier history stays on the Audit page. Turning it off and on again resumes where it stopped, so the entries made in between are sent too.
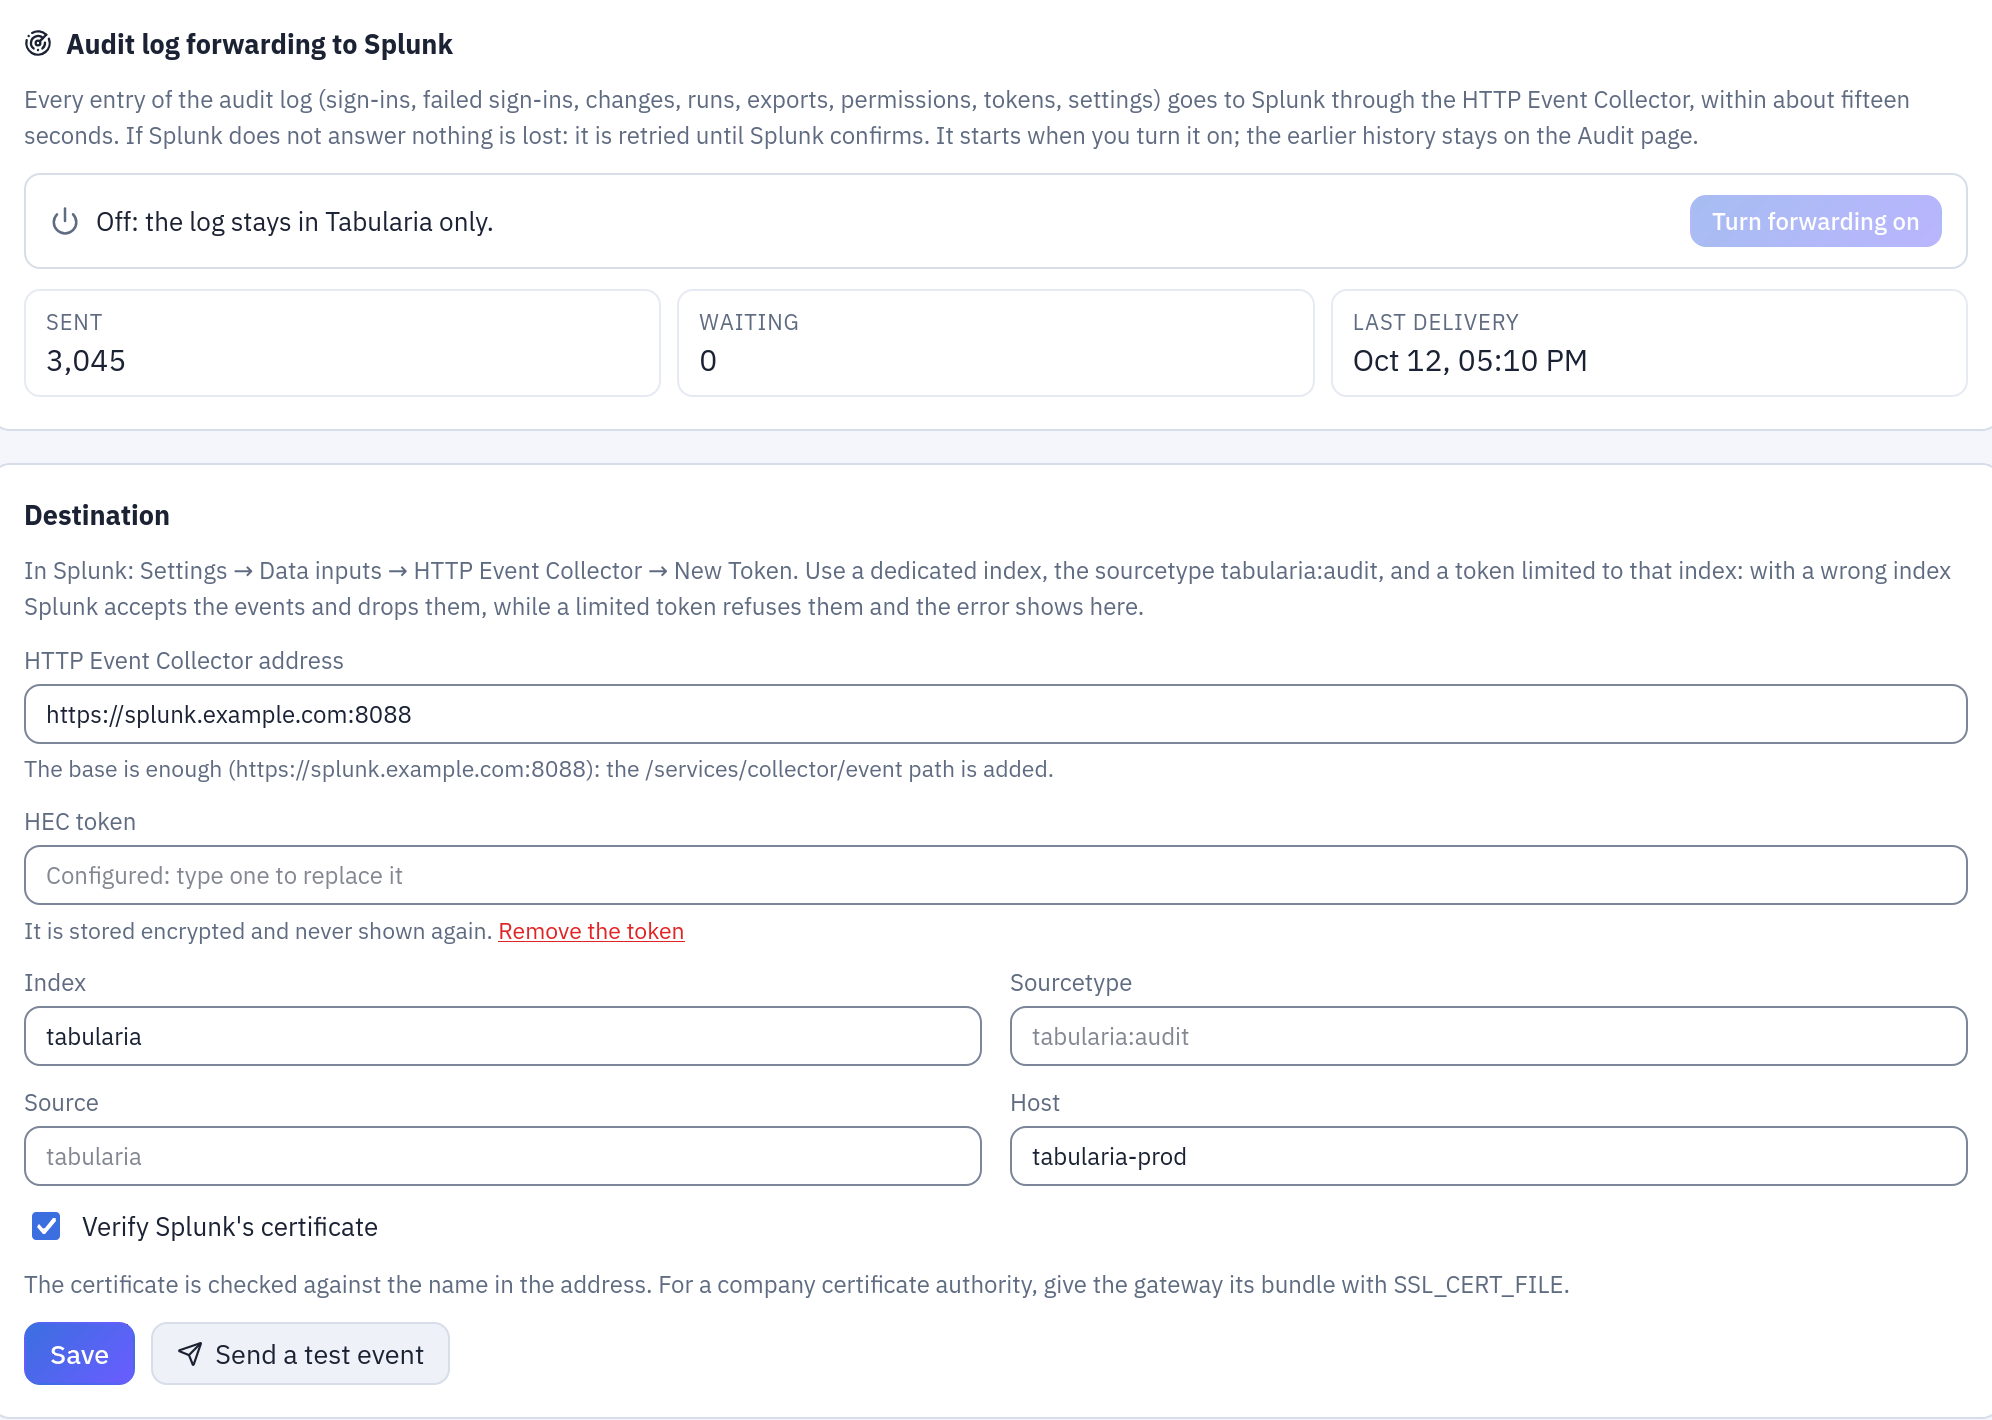
Administration → SIEM filled in as in the table above: the token is stored and never shown; Send a test event before Turn forwarding on.
The events
One HEC event per audit entry, with the entry's time as _time:
{
  "id": 2724,
  "time": "2026-10-12T15:46:46.707Z",
  "action": "auth.login_failed",
  "outcome": "failure",
  "user": "anna@example.com",
  "user_id": 12,
  "src": "10.1.2.3",
  "user_agent": "Mozilla/5.0 …",
  "target_type": "user",
  "target_id": 12,
  "target_label": "anna@example.com",
  "detail": {"reason": "password"},
  "app": "tabularia"
}
Empty fields are left out.
userandsrcare the names Splunk's CIM expects for who and from where.actionis the audit action:auth.login,auth.login_failed,flow.create,export.download,permission.grant,token.create,engine_settings.update, … (the Audit page lists them).detailcarries the action's context: the export format and rows, the token name when an API token did it, the old and new values of a setting.
Observers' IP addresses are not recorded, so their events have no src.
Useful searches:
sourcetype="tabularia:audit" action=auth.login_failed | stats count by user, src
sourcetype="tabularia:audit" outcome=failure | timechart count by action
sourcetype="tabularia:audit" detail.token=* | stats count by detail.token, action
Delivery
- Nothing skipped. The audit table is the queue. Tabularia remembers the last entry Splunk confirmed and moves on only after Splunk answers with success. If Splunk is down, or the token is wrong, entries wait. Retries come after 5, 10, 20 s and so on, up to 5 minutes, and resume from the first unconfirmed entry. The panel shows the waiting entries, the last error and the next attempt.
- At least once. A delivery interrupted between Splunk's answer and Tabularia
recording it is sent again. Every event carries the entry's
id:| dedup idremoves the rare duplicate. - In order, in batches of up to 500 events and under 1 MB.
- One sender. With several gateway replicas and orchestrators, a lock in the database lets one process send at a time.
- Entries are sent once they are at least 10 seconds old. An entry's id is assigned before it is committed, so a newer entry may become visible before an older one. The delay keeps the position from moving past an entry that is not written yet.
- Retention wins.
AUDIT__RETENTION_MINUTESis the promise made in the privacy notice. If Splunk receives nothing for longer than that, the oldest entries are deleted before they are sent. The panel shows how far behind forwarding is, so alerting on it is possible long before that.
TLS
The connection goes to the address the name resolved to, as for webhooks, and the
certificate is checked against the name. Public certificate authorities are
trusted. For a company authority, give the gateway its bundle with SSL_CERT_FILE
(the bundle replaces the public ones, so include them if needed).
Splunk's factory certificate is self-signed and issued for another name, so it fails
the check. The panel says so (CERTIFICATE_VERIFY_FAILED). Verify Splunk's
certificate can be turned off for that case, on an internal network only: without
the check, anyone in the middle can read the log and the token. A proper certificate
on the HEC is the real fix.
Who
- Administrators change the destination and send tests.
- Observers see the state, without the full address or Splunk's error text.
- API tokens cannot change the destination: a leaked token must not be able to redirect the audit log.
- Changes are audited: every change (
siem.update, with what changed but never the token) and every test (siem.test) is itself an audit entry, so it reaches Splunk as well.
Upgrading
Schema revision 0005 adds an empty siem_destinations table: forwarding stays off
until an administrator turns it on.