Pixel-perfect reports
A report is a page of fixed size, designed in the browser to the tenth of a millimetre: a header and a footer on every page, tables that group and subtotal over as many pages as the data needs, charts, gauges and KPI cards, texts written with expressions. It is an object of a folder, with its versions, like a flow or a SQL script. Readers open it on screen with its parameters and download it as PDF or Excel; a flow group sends it by email right after the data it shows is refreshed; a script downloads it through the API.
Use the Viewer to explore a datasource: filters, pivots and charts that change as you ask. Use a report when the answer has to arrive as a document: the same layout every month, page numbers and totals in their place, for people who never open Tabularia and read it as a PDF or in their inbox. Use a dashboard when the screen is the answer: tiles on a grid that adapt to the window and filter each other at a click. Every installation has reports, Docker Compose included, and the sample data comes with two of them to open and study.
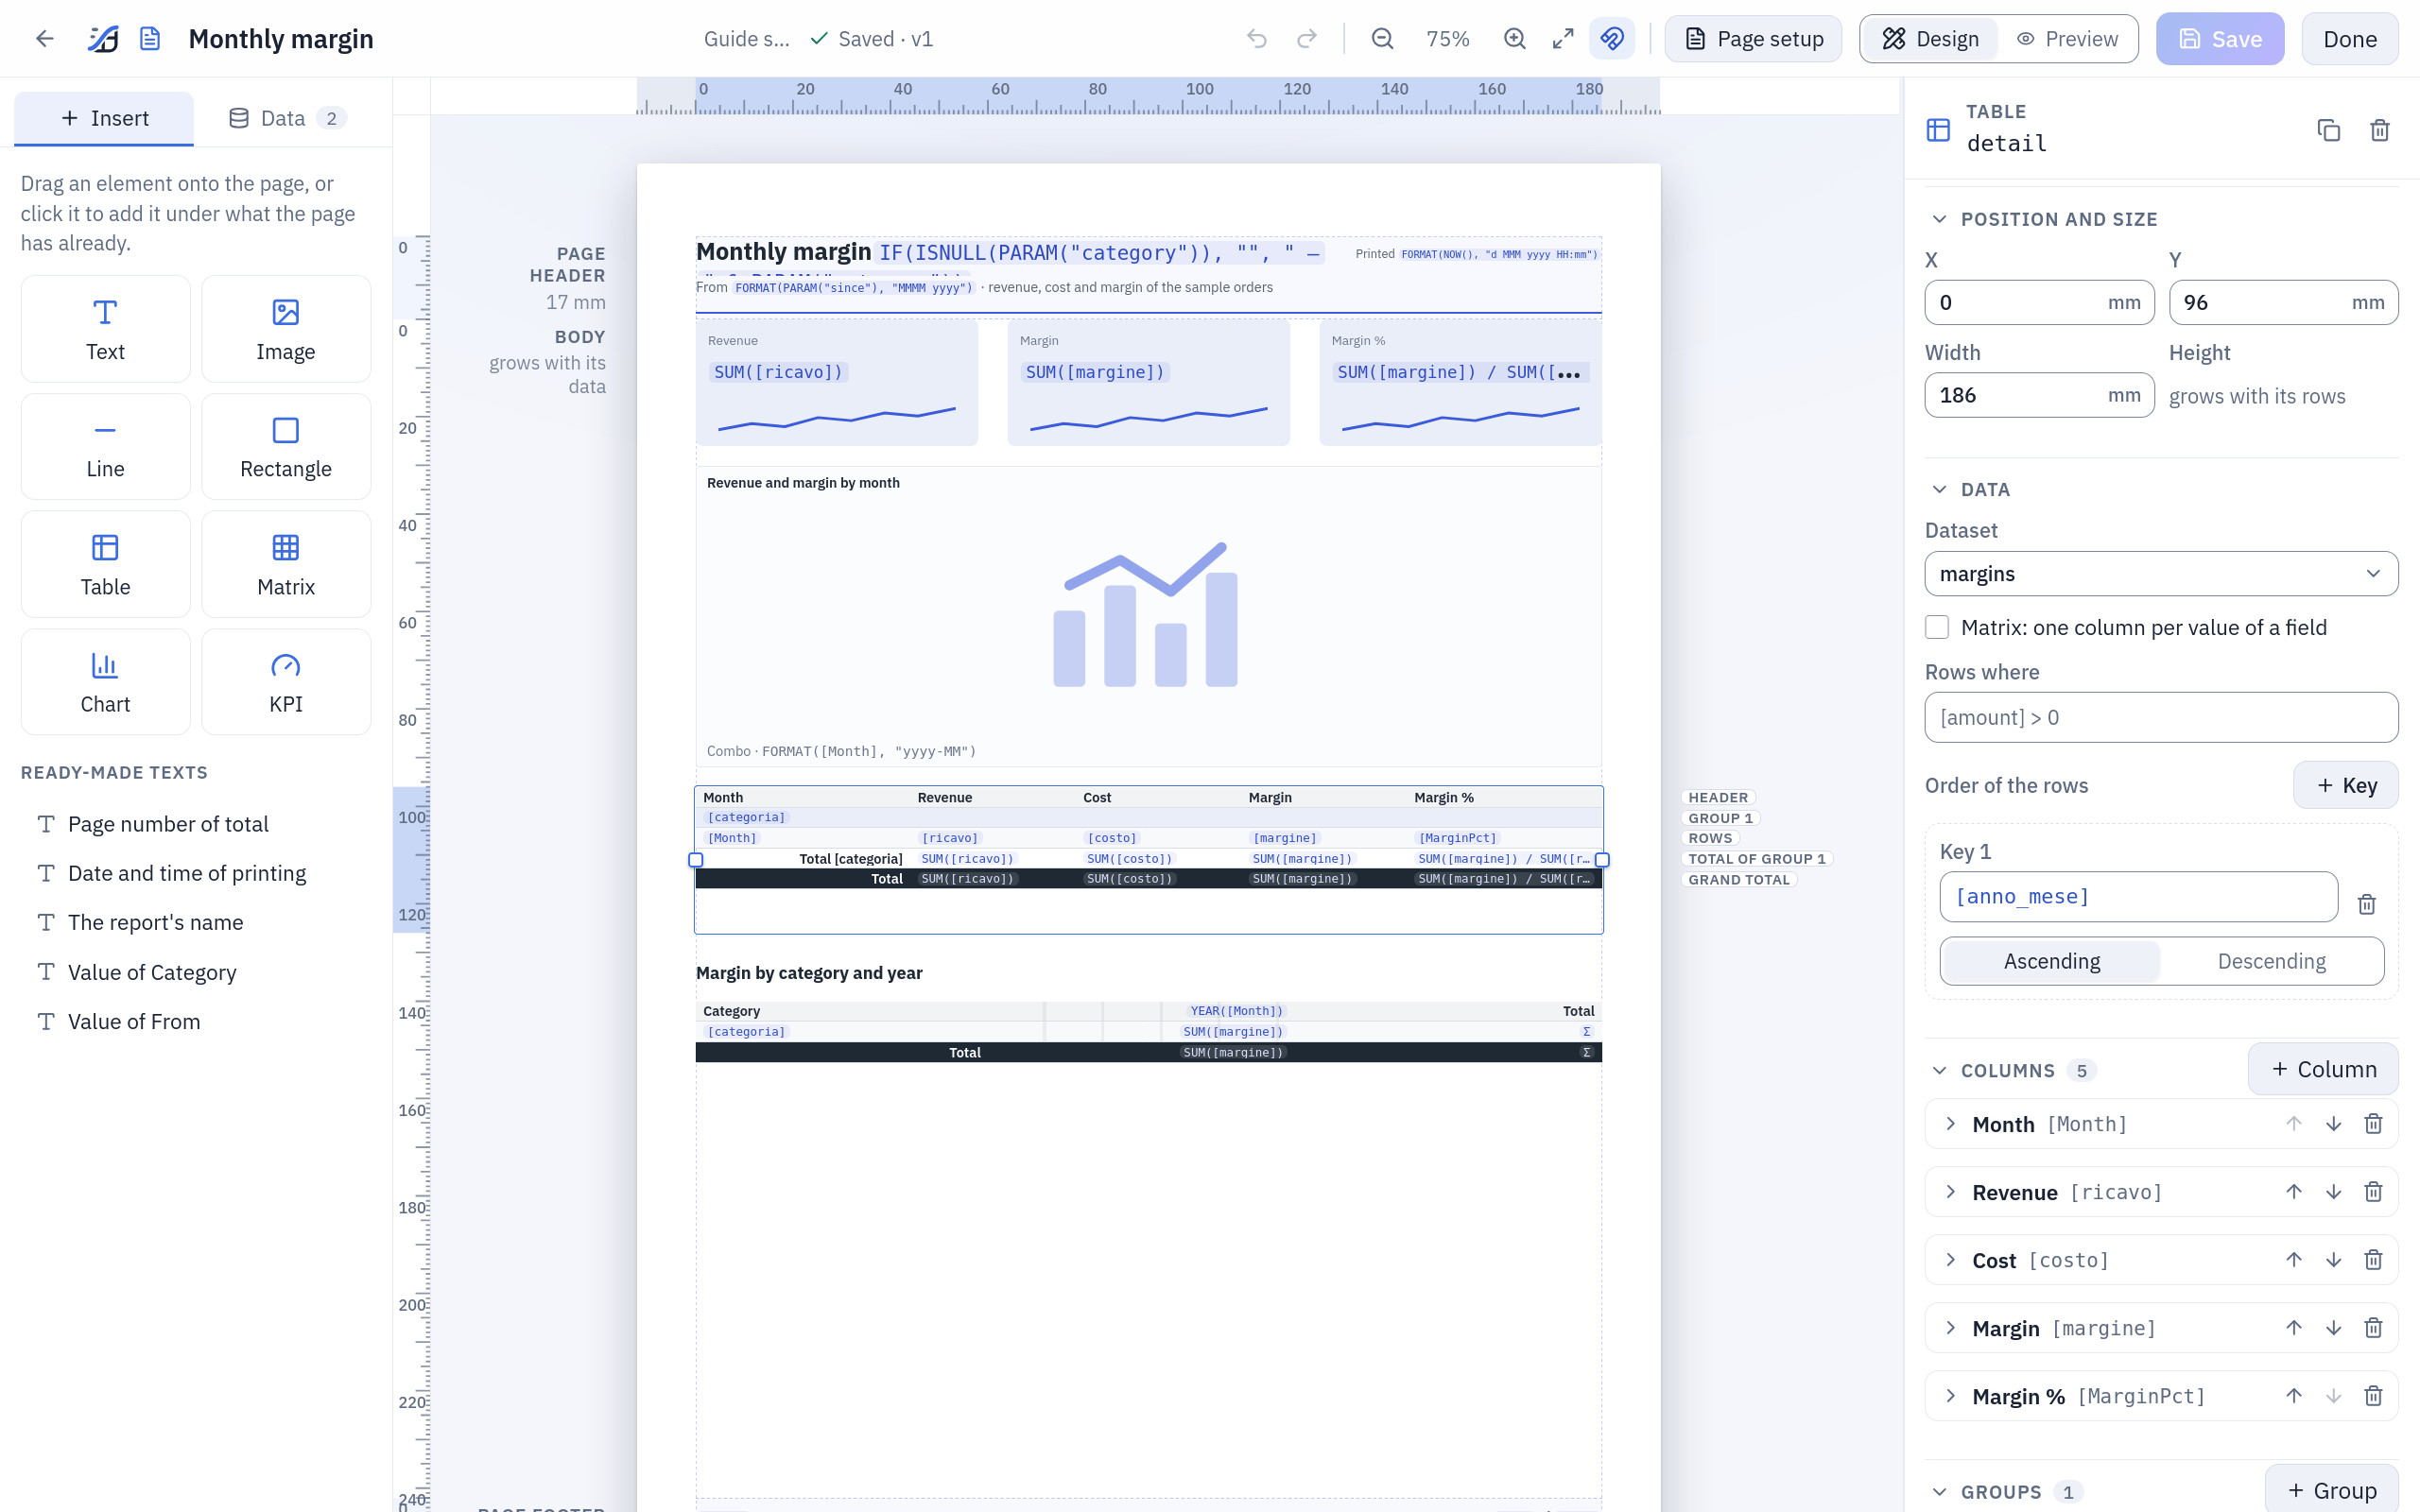
The designer with the report of the example below: the table is selected, its rows labelled on the right of the page (header, group, rows, the group's total, the grand total), its properties in the panel.
At a glance
| Where | Explore → New → Report, in a folder; it opens in the designer. Readers open it in the viewer from Explore or from Analysis → Reports, the most read first |
| What it reads | up to 20 datasets: SQL on the catalog or on a database connection, a datasource, a saved view, a saved SQL script |
| What it shows | texts and expressions, images, lines, rectangles, tables and matrices with groups and totals, 14 kinds of chart, KPI cards, and an AI comment on the numbers |
| Parameters | text, number, date or yes/no, one value or several, fixed choices or choices from a dataset; in the SQL as {name} |
| Formats | PDF (the page as designed), Excel (the tables with their groups and subtotals), the summary in an email |
| Sending | from a flow group's Pushmail cell, after the steps that refresh the data; a report has no schedule of its own |
| From code | GET /reports/{id}/render with an API token (API), tabularia.report() in a marimo notebook |
| Rights | VIEW on the folder to open and download it, EDIT to design it; the data is read with the rights of whoever reads the report |
| Limits | 3,000,000 rows per dataset and 200 pages per render by default (REPORTS__*) |
The designer
New → Report in a folder creates «New report» and opens it in the designer. The bar at the top holds the report's name (write over it to rename), its folder, whether it is saved and its version, undo and redo, the zoom, Snap to the millimetre grid, Page setup, Design and Preview, Save and Done (save and open the report as readers see it). The page sits in the middle with its rulers in millimetres; on the left, Insert holds the elements and Data the datasets and the parameters; on the right, the properties of what is selected: an item, a band (a click on its name beside the page) or, with nothing selected, the report.
The page and its bands
Page setup sets the paper (A4, A3, A5, Letter, Legal or a size of your own in
millimetres), the orientation and the four margins; the language of the report
(English, Italian, German, Spanish, French: the separators of the numbers, the names of
months and days, and the words the report writes by itself, «Page 1 of 3», «Total»); its
time zone ({today} and NOW() are read in it); and the theme: the font (the PDF
embeds IBM Plex Sans), its size, the text colour and the accent that colours the charts
and the sparklines.
A page has three bands:
| Band | What it holds |
|---|---|
| Page header, Page footer | a fixed height, printed on every page; Also on the first page and Also on the last page turned off leave them out there. Texts, images, lines and rectangles only: what is the same on every page (a title, a logo, the parameters chosen, "Page " & PAGE() & " of " & PAGES()). A field of a dataset is refused here; an aggregate of a named dataset, SUM([amount], "orders"), is not |
| Body | flows over the pages. Items whose heights overlap make a row and are placed side by side; a table takes its row alone, grows with its data and pushes down what is under it (an item dropped beside a table goes under it) |
Every position and size is in millimetres, to a tenth. Items snap to the millimetre grid while you drag them; the edges and centres of the other items always guide. Held near an edge of the page's area, a dragged item scrolls it. Where items overlap, the one drawn last is on top: in the header and the footer the one added last, in the body the one lower on the page (then the one more to the right), in the designer as in the PDF: a rectangle meant as a background starts at or above the texts it frames.
Elements
Drag an element from Insert onto the page, or click it to add it under what the page holds already:
| Element | What it is |
|---|---|
| Text | text as written, or an expression when it starts with =: ="Sales in " & PARAM("region"). Size, weight, italic, colours, alignment, padding, border, a format, and Grows with a long text |
| Image | a PNG, JPEG or SVG of at most 512 KiB, kept inside the report (never a link): Whole, Fill or Stretch. An SVG that links outside itself or runs scripts is refused when the report is saved |
| Line, Rectangle | a rule, a frame or a coloured band |
| Table | the rows of a dataset, with columns, groups, subtotals and totals: tables and matrices |
| Matrix | a table with one column per value of a field |
| Chart | 14 kinds, chosen when it is placed: charts and KPIs |
| KPI | one value in large type, its change against another and a sparkline |
| AI comment | a short text the configured AI model writes on the numbers of the elements you pick: below |
Ready-made texts are texts written for you: Page number of total, Date and time of printing, The report's name, and Value of … for each parameter.
In Data, a field dragged onto a table becomes a new column, and anywhere else in the body a text that shows it; a click on a field adds it as a column to the selected table. A table reads one dataset: a field of another is refused.
The keys: Ctrl+S saves, Ctrl+Z and Ctrl+Shift+Z undo and redo; on the page, the arrows move the selected item by 1 mm (5 mm with Shift), Ctrl+D duplicates it, Ctrl+C and Ctrl+V copy and paste, Del removes it. A copy can be pasted into another report, open in another tab too; if it read a dataset that report does not have, it reads its only dataset, or waits for one to be chosen, and says so. Tab goes through the bands' names and the items; Enter on a band's name selects it.
Saving and the preview
Save keeps the report as a new version. The server checks the whole definition at
every save: a field that does not exist, a function with the wrong arguments, a text
added to a number. A save it refuses lists the problems in the bar; the first item is
selected and the message sits under its field, with the character where the mistake
is. The expression fields check what they can while you type: an expression you are still
writing (SUM([ric) is not a mistake, and is said only if you leave the field that way; one
that is finished and wrong is said at once. After a pause the server checks the report as
a save would (the types, where a field may be used, the formats) and says what it finds
under the same fields. If someone else saved
the report since you opened it, Save says so and asks before your version becomes
the newest: theirs stays among the versions.
Preview renders the report as it is on screen, saved or not, with the values of its parameters you choose in the same form the viewer has (the lists read from a dataset included): the same renderer as the PDF, so what you see is what will print. A report with mistakes is not rendered: the preview lists them, and a click on one takes you to its field in Design.
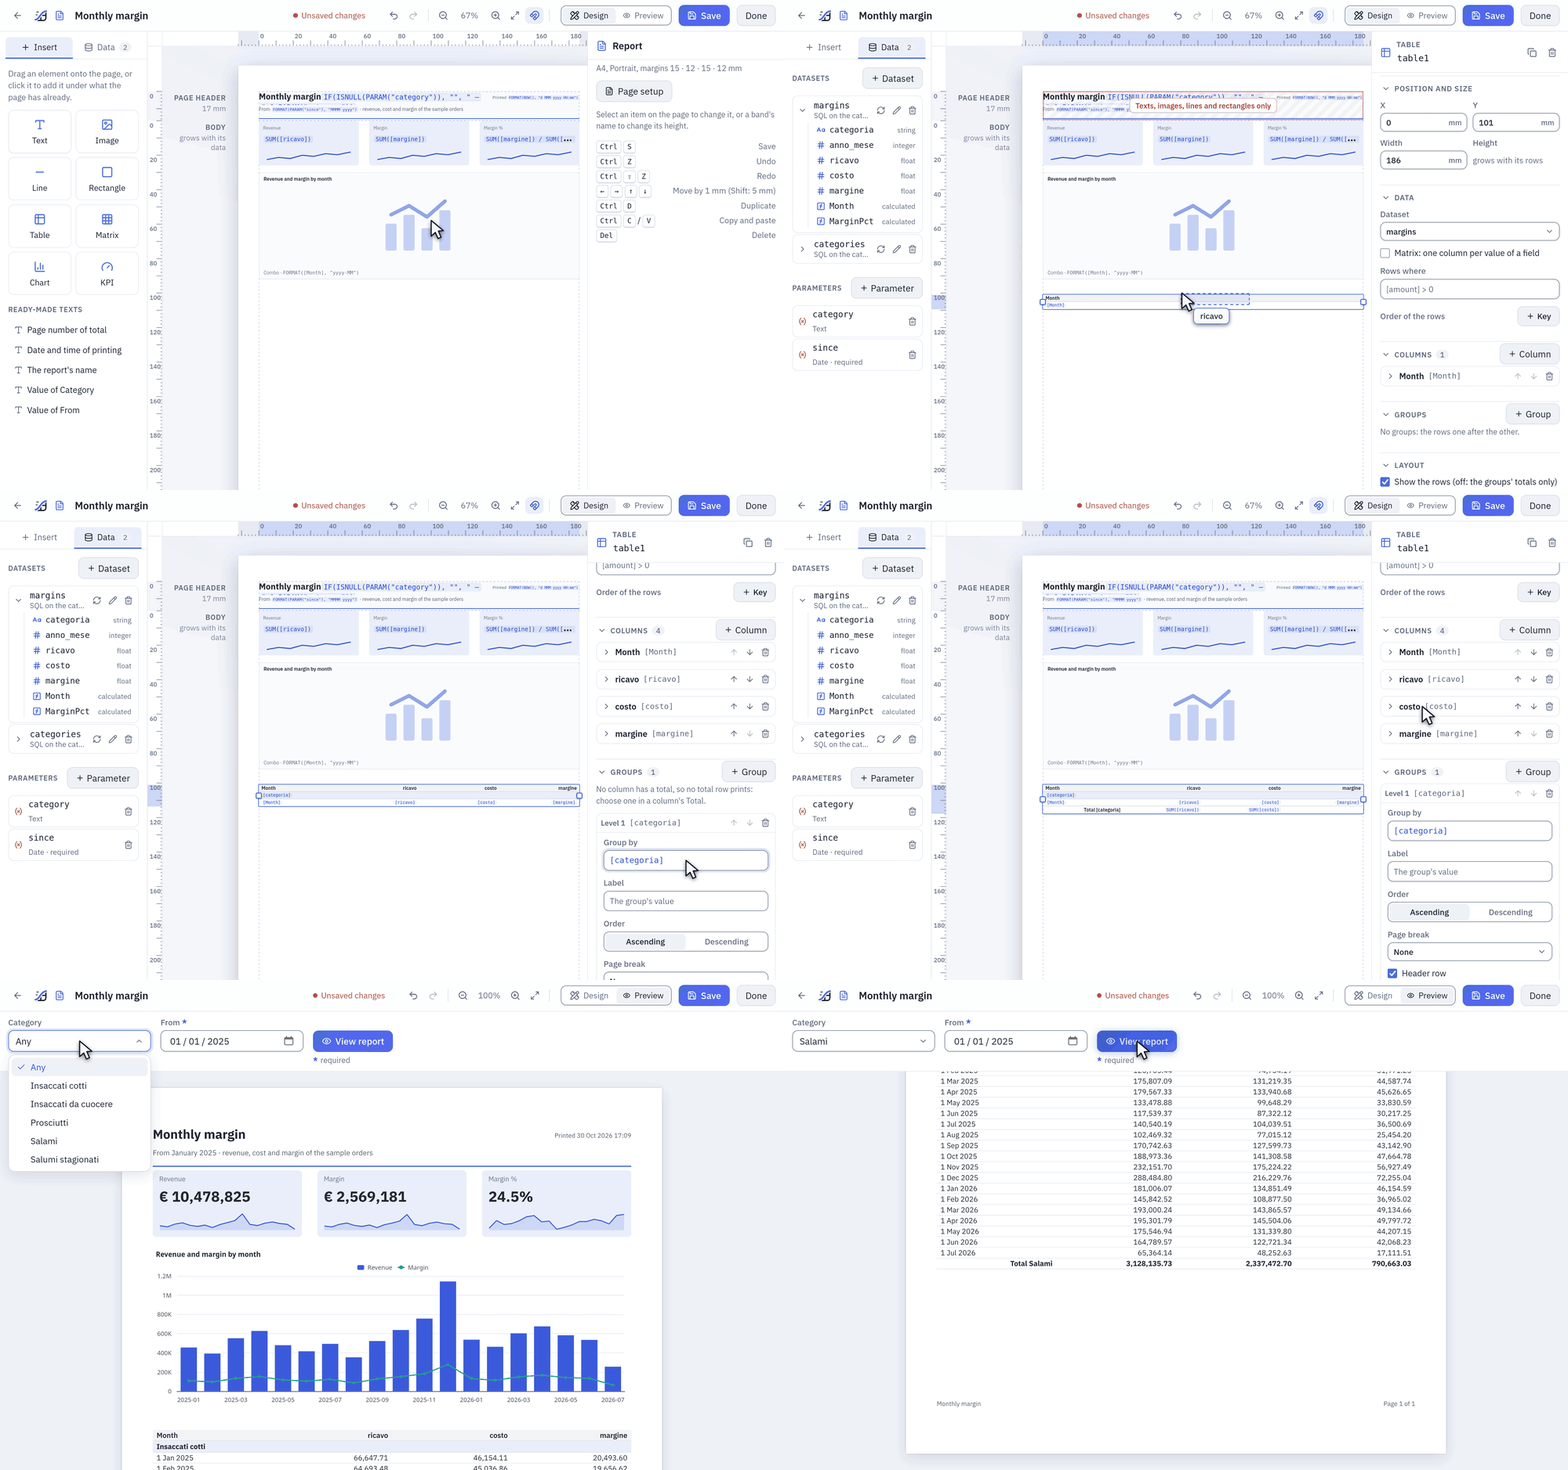
A table under the chart: four fields dragged into it, a group by [categoria] written in its properties. A new column has no total: Sum, chosen in the Total of each amount, brings the group's total row. Preview asks for the parameters as the viewer does, here Category Salami.
Datasets and parameters
A dataset is a set of rows the report reads; the items of the report each read one. In Data, + Dataset:
| Data from | What it reads |
|---|---|
| SQL | a query on the catalog (the datasources you may read, by name, on the engine you choose, as in a SQL script) or on a database connection (in the database's own dialect, with CONNECT on the connection's folder). Only a query runs, as in a SQL script; as there, the barrier is a read-only database user on the connection |
| Datasource | a datasource as it is, with optional filters (a column, = <> < <= > >= in contains, a value or a parameter) applied before the rows are read |
| Saved view | a saved view with its filters, computed fields and pivot, plus filters of its own |
| SQL script | a saved SQL script, its current version, on its catalog or connection: whoever changes the script changes the report. Its parameters are the report's |
A parameter goes in the SQL as {name}, without quotes: Tabularia writes its value
as a literal of the dialect, never as text pasted into the query. A text is quoted and
escaped, a number checked as a number, a date written DATE 'yyyy-mm-dd', a list
(a, b, c) for IN {regions} (an empty list stops the render and says so). A parameter
written inside quotes, '{region}', is refused: «write {region} without quotes:
Tabularia quotes it». Tabularia's own placeholders work too,
{today-30}, {start_of_month}, read in the report's time zone.
Fields are the columns the designer last read from the data (Refresh fields):
they feed the completion and the checks; the render uses what the data has.
Refresh fields also counts the dataset's rows with the parameters' defaults and shows
the number under the dataset: past 500,000 rows an orange warning gives the time a render
will take, past REPORTS__MAX_ROWS a red one says the report will not render. Aggregate
in the SQL and format in the report: SELECT region, SUM(amount) AS amount FROM orders GROUP BY region gives the report one row per region, not one per order.
Calculated fields are expressions computed for every row, used as any other field.
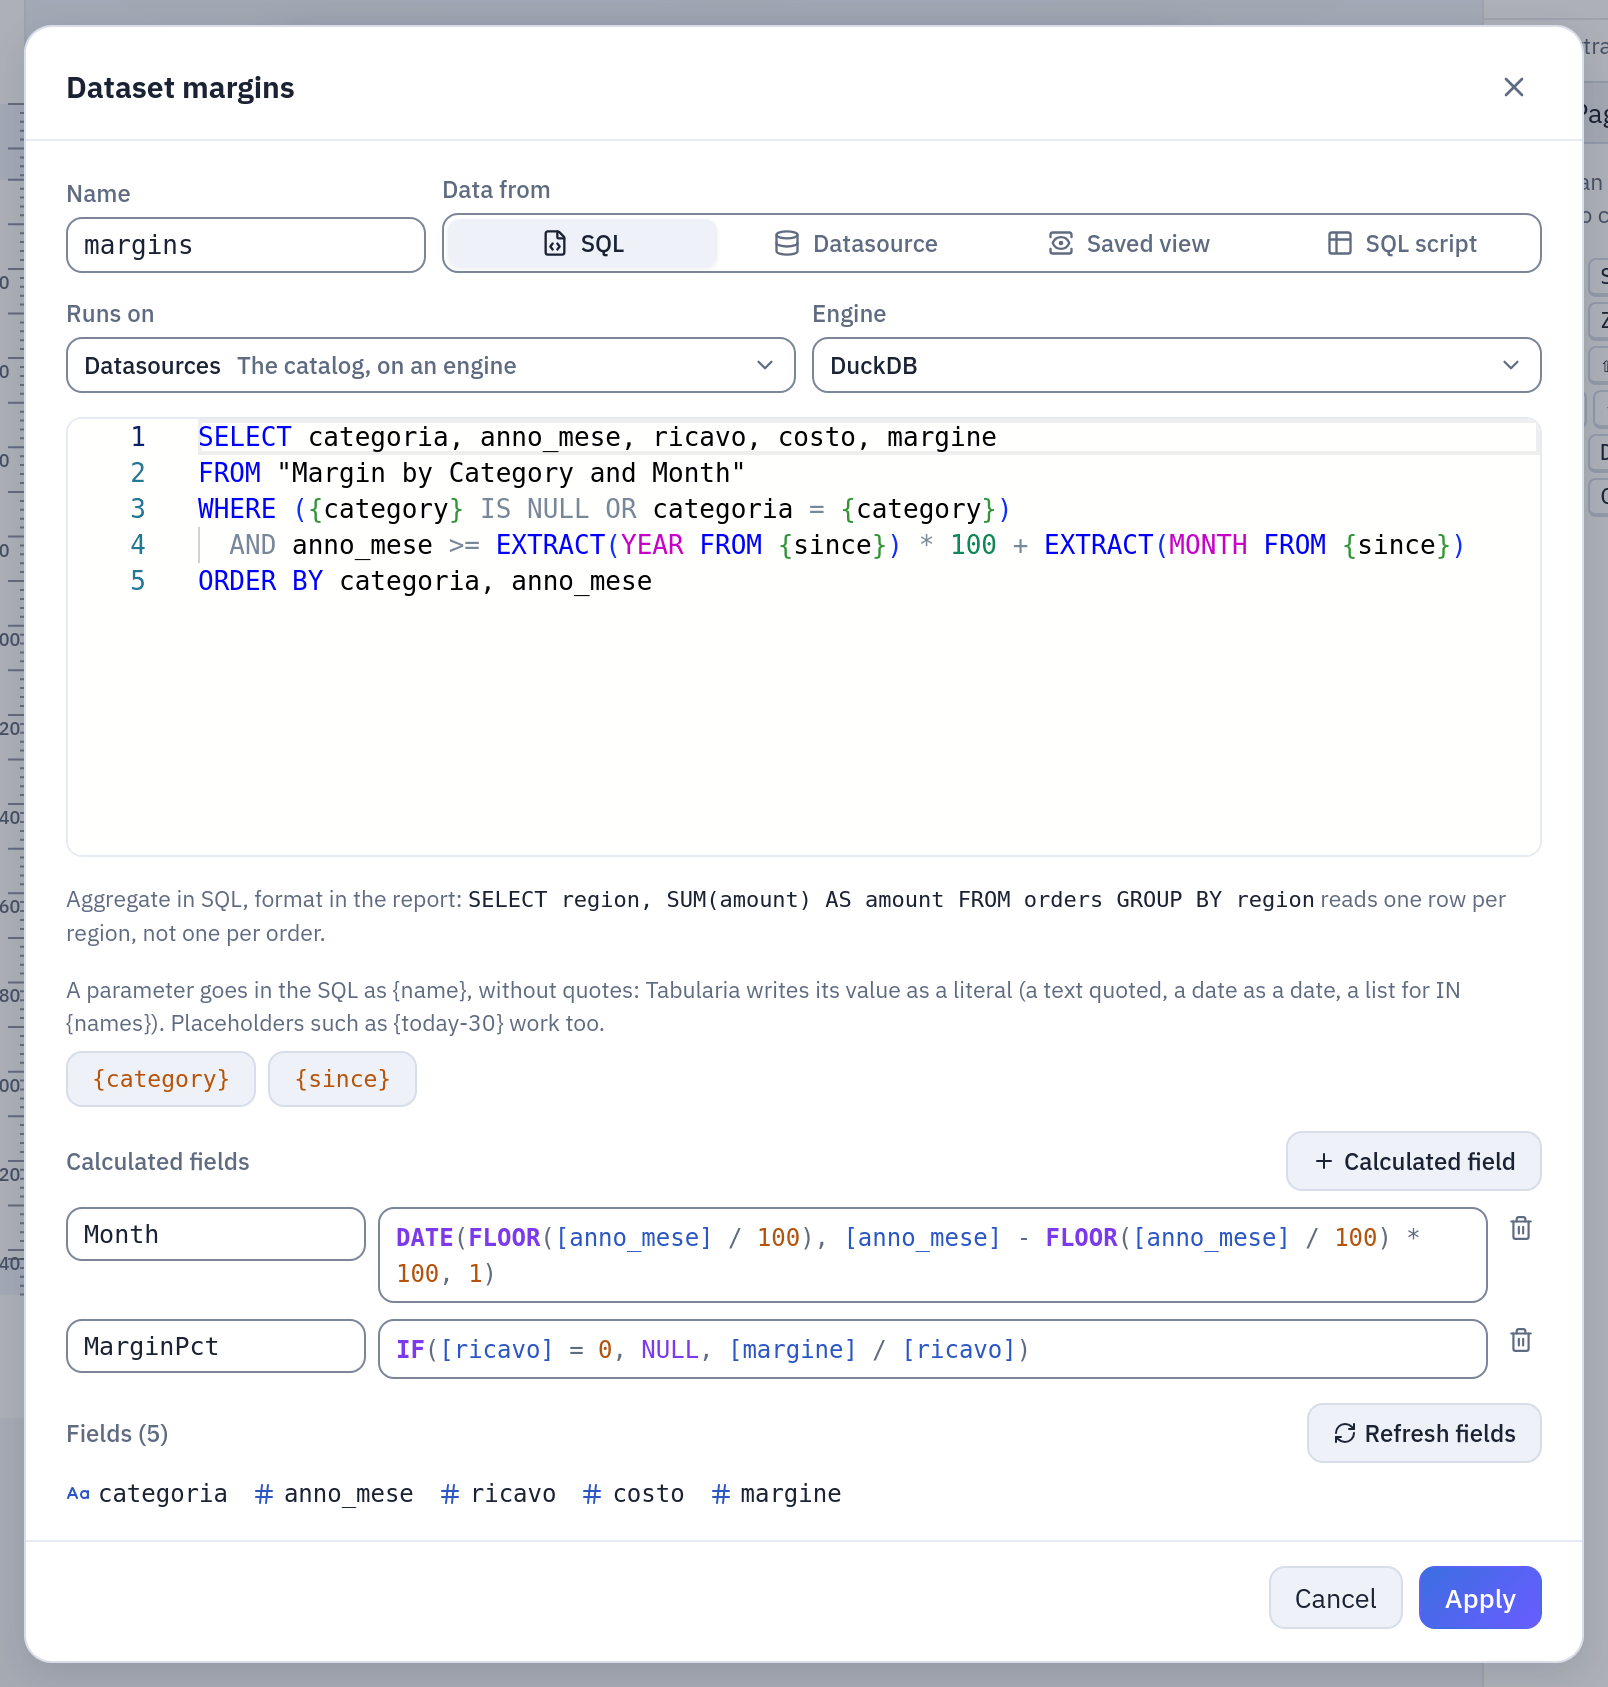
The dataset of the example: the SQL with its two parameters in braces (the chips under the editor insert them), the calculated fields Month and MarginPct.
A parameter is a value the reader chooses. In Data, + Parameter:
| Field | |
|---|---|
| Name | letters, digits and _; not a name of Tabularia's placeholders (today, now…). In the SQL {name}, in an expression PARAM("name") |
| Label in the form | what the reader sees |
| Type | Text, Number, Date or Yes or no; Several values makes it a list |
| Required | the report does not render without a value |
| Default | used when the reader gives none: a value, or for a date a placeholder resolved at every render, {today-30}, {start_of_month-1m} |
| Choices | Any value, a Fixed list (one per line), or From a dataset (an expression for the value and one for the label shown) |
Values arrive as text (the viewer's form, a flow group's cell, the query string of the API) and are converted and checked against the type and the choices before anything runs: a value that does not fit stops the render with the parameter's name.
A parameter that filters the data
The usual parameter takes its choices from a field of a dataset, and filters that same dataset by what the reader chooses:
- + Parameter: a name,
regione, Choices → From a dataset, the dataset and, as Value, the field:[area]. - With a datasource or a saved view, Filter this dataset by what is chosen is already
ticked: it adds the filter
area = {regione}to the dataset (area in {regione}with Several values), and takes it away when you untick it. - With a SQL or a SQL script the query stays as you wrote it: the dialog shows the line
to add,
WHERE {regione} IS NULL OR area = {regione}, with a button that copies it.
That is all. The list always shows every value of the field, whatever is chosen: to read
it Tabularia leaves out what depends on that parameter, while the report itself applies
the filter. If the parameter is not required, with nothing chosen (Any) every row stays.
With Several values a SQL needs at least one value (IN {regione}), and the report
asks for it; a filter on a datasource or a view lets every row through with none.
Several parameters on one dataset work the same way, and follow the order of the form:
add regione, then agente, and the agents follow the region while the regions stay all
there. To take the choices from somewhere else, a table of regions or a list you curate,
choose another dataset as their source: the filter on the data is then yours to add. Two
lists that follow each other through two different datasets are refused, by name, because
neither could be chosen first.
In a SQL, Tabularia recognises the conditions on the parameter in the WHERE, the
HAVING and the ON of a join, in subqueries too, and takes them for true when it reads
the list. Written anywhere else, say in the columns or in a LIMIT, the parameter reads
NULL for the list, as with no value; if that leaves the list empty, the form says so and
what to do.
The value of a filter on a datasource or a view is chosen in the dataset's dialog: A
value written here, or a parameter of the report, by its label and name. A parameter of
several values sets the operator to in, one of a single value takes it back to =, and
the dialog says so. Written by hand, {regione} and PARAM("regione") both become the
parameter, and a name that does not exist is an error on the spot, with the name you
probably meant. Renaming a parameter carries its filters and its SQL with it (a saved SQL
script is its own text: the designer tells you to change it there); removing one takes its
filters away and tells you which SQL still writes it.
Expressions
Expressions are a small language of Tabularia's own, close to spreadsheet formulas. The
server parses and evaluates them, never runs them as code. They go wherever a value is
computed: a text that starts with =, a column's value and total, a group's key and
label, a rule's condition, a chart's axis and series, a KPI, a table's Rows where
and its sort keys, an item's Shown when, a calculated field.
| Write | For |
|---|---|
[ricavo] | a field; ]] for a ] in its name |
"text", 12.5, TRUE, FALSE, NULL | values; "" for a quote inside a text |
{today-7} | a date placeholder, in the report's time zone |
+ - * / | arithmetic; a date plus a number moves it by days, a date minus a date is days |
& | joins texts: "Total " & [region] |
= <> < > <= >= | comparisons, one at a time: join two with AND |
AND OR NOT | conditions |
SUM(...) | functions, in capitals or not |
!=, ==, &&, ||, ^, % and texts in single quotes are not part of the
language: the check says what to write instead. NULL goes through arithmetic and
comparisons (NULL + 1 is NULL), aggregates skip it, a division by zero is NULL, &
writes it as nothing, and a condition that is NULL is false.
Where an aggregate counts. An aggregate works on the rows of the place it sits in:
in a group's total row, the group's rows; in the grand total, the table's; in a text, a
KPI or a chart of the body, the rows of its dataset. A dataset named as the last
argument, SUM([amount], "orders"), reads that whole dataset instead, which is the only
way to show data in the page header and footer. A field written outside a row (in a
group's total row) is the value of the group's first row.
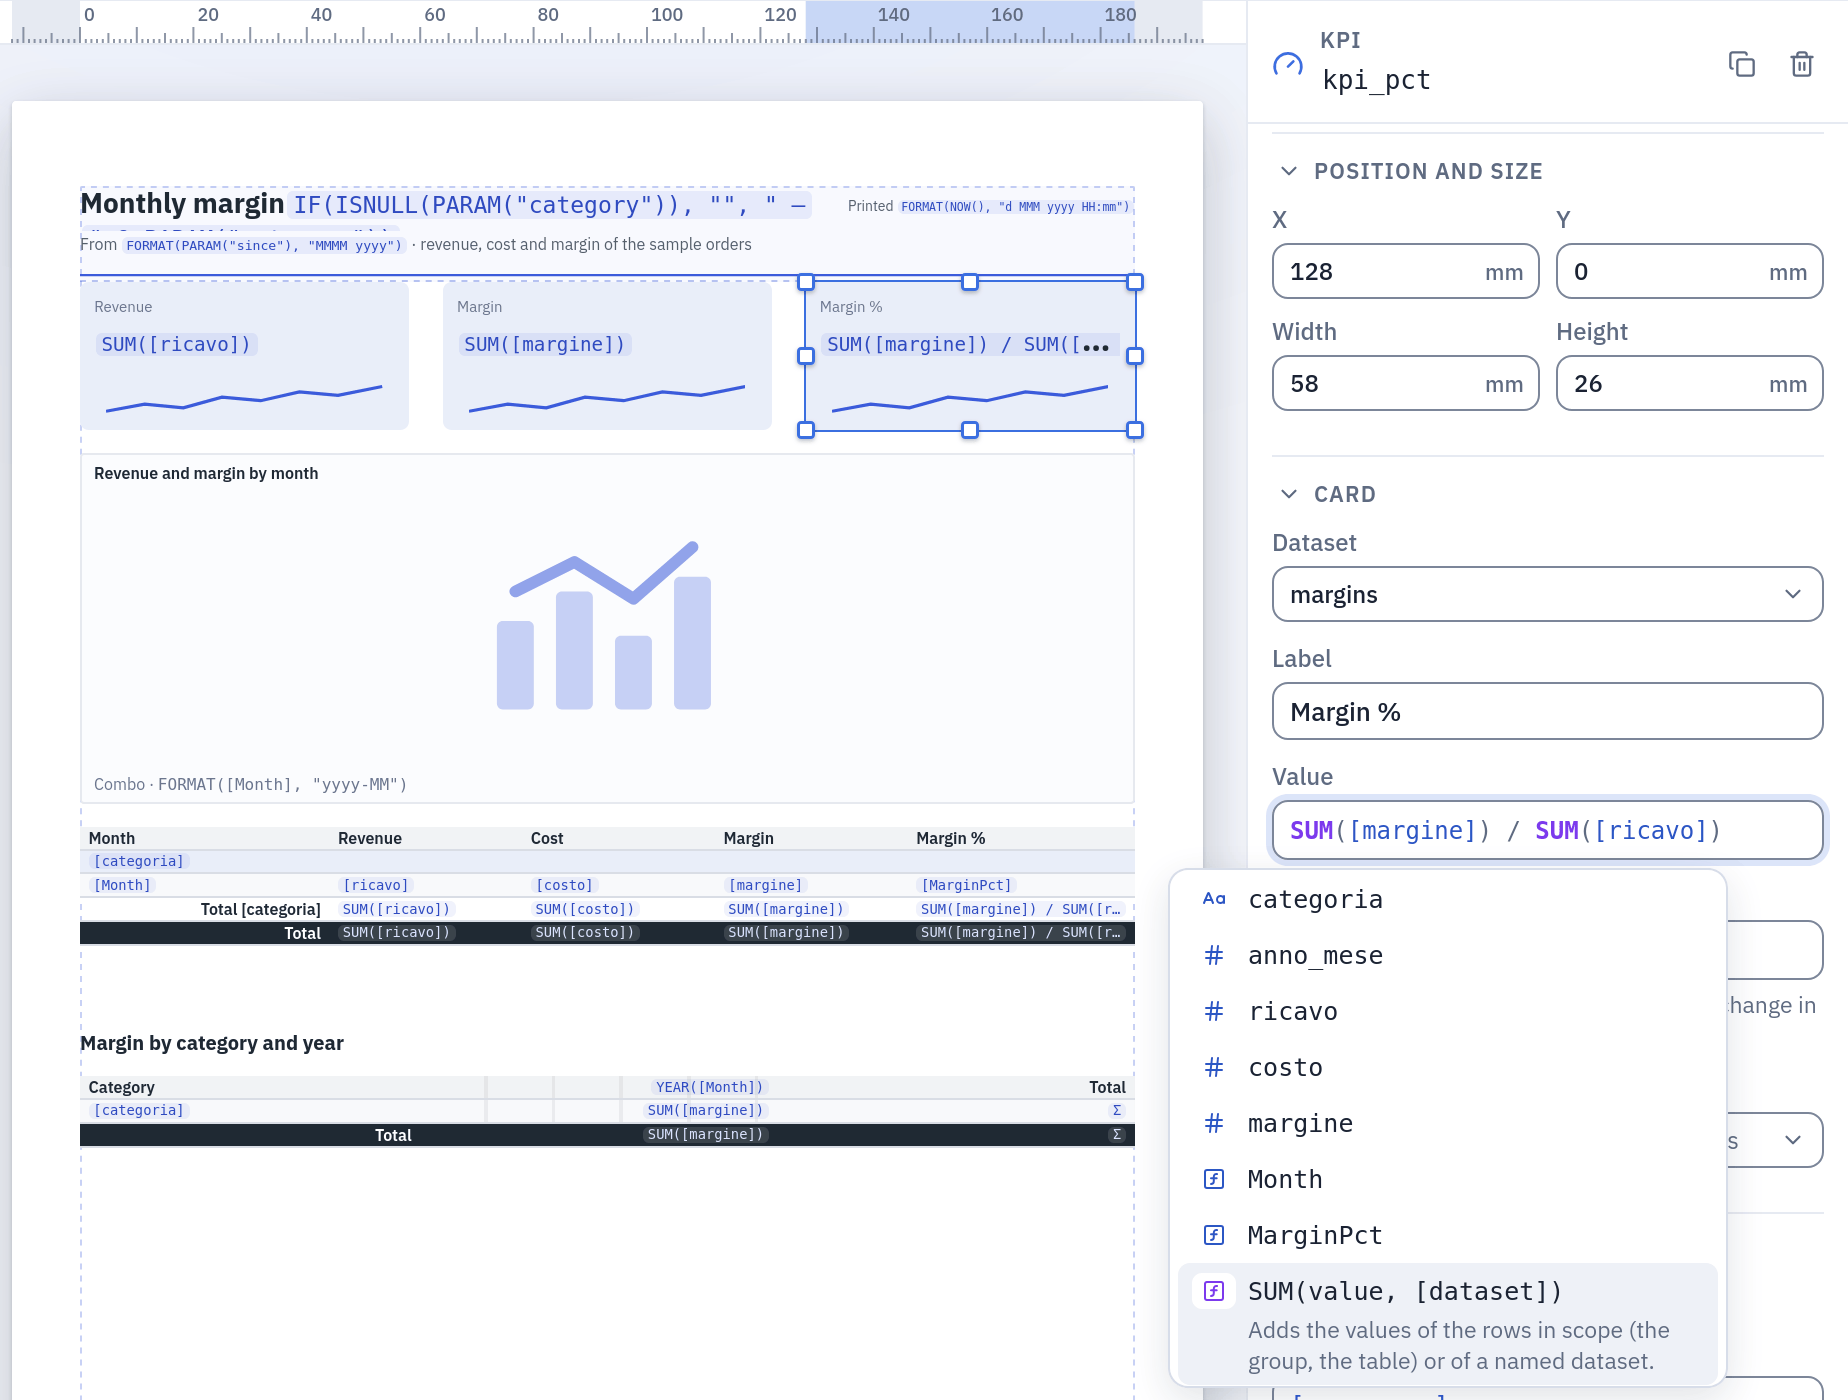
The completion (Ctrl+Space, or [ for the fields): the dataset's fields with their types, the calculated ones, then the functions with their arguments; the highlighted one says what it does.
Functions
Every function with its cases and an example on the sample data, with the result it prints, is in Report functions, with recipes for a real report: the margin percentage, the growth on the month before, the share of a level you choose, the year before, a value from a price list, the sum of a period, running totals, thresholds, dates in titles.
| Function | Arguments | Gives |
|---|---|---|
SUM, AVG | value, [dataset or group] | the sum, the average of the values, NULLs left out |
MIN, MAX | value, [dataset or group] | the smallest, the largest value |
COUNT | [value], [dataset or group] | how many rows; with a value, how many are not NULL |
COUNTDISTINCT | value, [dataset or group] | how many different values |
FIRST, LAST | value, [dataset or group] | the value of the first, the last row |
SUMIF | condition, value, [dataset or group] | the sum over the rows where the condition is true: SUMIF(YEAR([day]) = 2025, [amount]) |
COUNTIF | condition, [dataset or group] | how many rows have the condition true: COUNTIF([state] = "open") |
PERCENT | aggregate, [group] | the aggregate as a share of the same one level up, a row of its group, a group of the whole, or of the group named: PERCENT(SUM([amount]), "region") |
RUNNING | aggregate | the running total within the group, row after row: RUNNING(SUM([amount])) |
PREVIOUS | value | the value on the row above in its group; in a total, on the group before: [amount] / PREVIOUS([amount]) - 1 |
LOOKUP | key, key field, result, [dataset] | the result on the rows whose key field equals the key: a field of the first, an aggregate of them, NULL if there are none: LOOKUP([code], [sku], [price], "prices") |
ROWNUMBER | the number of the row within its group, from 1 | |
IF | condition, value if true, [value if false] | one value or the other; without the third, NULL |
IFS | condition1, value1, condition2, value2, …, [else] | the value of the first true condition, else the last argument |
ISNULL | value | true when the value is missing |
COALESCE | value1, value2, … | the first value that is not missing |
ROUND | number, [decimals] | rounded half away from zero, to 0 decimals by default |
ABS, FLOOR, CEILING | number | without its sign, rounded down, rounded up |
POWER | number, exponent | a number raised to the exponent |
UPPER, LOWER, TRIM, LEN | text | in capitals, in lower case, without spaces at its ends, its length |
LEFT, RIGHT | text, count | the first, the last characters |
MID | text, start, count | part of a text, from a position (1 is the first character) |
REPLACE | text, old, new | every occurrence of old replaced |
CONTAINS, STARTSWITH | text, part | true when the text contains, starts with, the part |
TEXT | value | the value as text, as the report would write it |
CONCAT | value1, value2, … | the values joined as one text |
DATE | year, month, day | a date; an impossible one (30 February) is NULL |
YEAR, MONTH, DAY | date | the year, the month (1 to 12), the day of the month |
WEEKDAY | date | the day of the week, 1 (Monday) to 7 (Sunday) |
DATEADD | unit, count, date | the date moved by "d" days, "w" weeks, "m" months or "y" years; 31 January plus a month is the last day of February |
DATEDIFF | unit, start, end | whole days, weeks, months or years from start to end |
TODAY, NOW | today's date, the date and time of the render, in the report's time zone | |
FORMAT | value, pattern | a number or a date as text: FORMAT([day], "d MMM yyyy") (the patterns are below) |
PAGE, PAGES | the page's number and how many pages there are; only in a text, joined with & | |
PARAM | "name" | the value of a parameter, the name in quotes |
REPORT | the report's name |
Arguments in brackets are optional. An aggregate takes one value at a time: write
SUM([a]) / SUM([b]), not an aggregate inside another.
Formats
The Format of a text, a column, a chart or a KPI, and the second argument of
FORMAT(), is a pattern. , and . mark where the separators go; the characters
written are those of the report's language.
| Pattern | Value | English | Italian |
|---|---|---|---|
0 | 202401 | 202401 | 202401 |
#,##0 | 10478825.4 | 10,478,825 | 10.478.825 |
#,##0.00 | 1234.5 | 1,234.50 | 1.234,50 |
0.0% | 0.2453 | 24.5% | 24,5% |
€ #,##0 | 2569181 | € 2,569,181 | € 2.569.181 |
#,##0 pcs | 1200 | 1,200 pcs | 1.200 pcs |
#,##0;(#,##0) | -1500 | (1,500) | (1.500) |
#,##0;-#,##0;- | 0 | - | - |
d MMM yyyy | 2026-03-05 | 5 Mar 2026 | 5 mar 2026 |
MMMM yyyy | 2026-03-05 | March 2026 | marzo 2026 |
dd/MM/yyyy | 2026-03-05 | 05/03/2026 | 05/03/2026 |
EEEE d MMMM | 2026-03-05 | Thursday 5 March | giovedì 5 marzo |
HH:mm | 14:30 | 14:30 | 14:30 |
- Numbers:
0a digit always written,#one written only when needed,%multiplies by 100; text before or after the digits as it is, in double quotes when it holds0,#or%. Up to three sections separated by;: positive, negative, zero. Rounding is half away from zero. French groups with a space (1 234,50); Spanish starts grouping at five digits (1234, but 12.345). - Dates:
yyyyyythe year,MMMMMMMMMMthe month (name, short name, two digits, one or two),dddthe day,EEEEEEEthe day of the week,HHHthe hour,mmmthe minutes,sssthe seconds.Mis the month andmthe minute. Text goes in single quotes,''for an apostrophe. - Without a format a whole number is written as it is (a year or a month code is
never «2,026»), other numbers with separators and up to two decimals, a date in the
language's own way (
d MMM yyyyin English,dd/MM/yyyyin Italian, Spanish and French,dd.MM.yyyyin German), a yes/no as Yes or No. - In Excel a cell keeps the raw number or date, with the same pattern as its number format, so it can still be summed; a pattern that does not say how to write negatives writes them in red.
Tables and matrices
A table lists the rows of its dataset and grows over as many pages as they need, its header repeated at the top of every page. Its properties:
| Section | |
|---|---|
| Data | the dataset; Rows where, a condition that keeps some rows; Order of the rows, keys with their direction |
| Columns | for each: Header, Value (an expression), Width (millimetres, or automatic), alignment, Format, Total (None until you choose one: Sum, Average, Minimum, Maximum or Count of the column's value, or an Expression…, an aggregate of your own such as SUM([margine]) / SUM([ricavo]); printed in the groups' total rows and in the grand total), the style of its cells and its Conditional formatting |
| Groups | up to six levels, each with Group by (an expression), Name in expressions (how an aggregate names the group; a group by a field already has its name), Label, Order, Page break (none, between groups, after each group), Header row, Total row and Keep the last rows with their total |
| Layout | Show the rows (off: the groups' totals only), Grand total at the end, Header on every page, Alternate row shading |
| Sheet name in Excel | the table's sheet when the report is downloaded as Excel |
| On screen | Sort by a column with a click on its header, Close and open the groups: what the reader may do in the viewer |
No column gets a total by itself: a field dragged onto a table, a column added and a new table have none, because a price or a discount does not add up and only you know which values do. The table's first total, when no row is there to print it, turns on Grand total at the end; turn it off if you want the groups' totals alone. A table where no column has a total prints no total rows at all, not even empty ones, and the designer draws none (a group with its Header row off keeps its Total row: it is all that names the group).
A group's total row reads «Total» and the group's label, across the columns before the first one that has a total; when the first column has a total too, the label takes a row of its own above the values. A group whose value is missing is named «(blank)». A group that goes on over the next page repeats its label there. Keep the last rows with their total never leaves a total alone at the top of a page. A table with no rows says «No data», with no total of nothing.
Columns whose widths add up to more than the table are narrowed to fit it, and a value wider than its column (a long number in a narrow column) would run into the next one: the preview and the viewer say both, naming the table and the columns, so the design can be fixed. So does an item that goes past the edge of the paper, and a KPI whose value is wider than its card.
Conditional formatting gives a column's cells a style when a condition about their
row is true: [MarginPct] < 0.3 in red and bold. A column may have several rules; when
more than one holds, the later ones win where they differ. Rules colour the rows'
cells, not the totals.
A matrix is a table with One column per value of an expression (at most 60
columns): YEAR([Month]) gives a column per year. Its groups make the rows, Value of
the cells is an aggregate of the rows that meet there (SUM([margine])), Total
column, which a new matrix leaves off, adds the row totals, and Grand total at the end
adds the column totals.
The columns come in the order of the data: each value where it first comes in the rows the
table reads, after its Rows where and its Order of the rows, as a chart's categories
do with «In the data's order». With levels of columns, each one's values follow the same rule
inside the value above them. So the ORDER BY of the dataset's SQL decides: with ORDER BY anno_mese, a column per FORMAT([Month], "MMM") reads Jan, Feb, Mar. A value that the first rows
do not have comes where it first shows up, so sort by what makes the columns, before the
rest. A query without ORDER BY has no order the database promises, and the columns may
change from one run to the next: order the dataset, or the table. A missing value is a
column too, «(blank)», in its place.
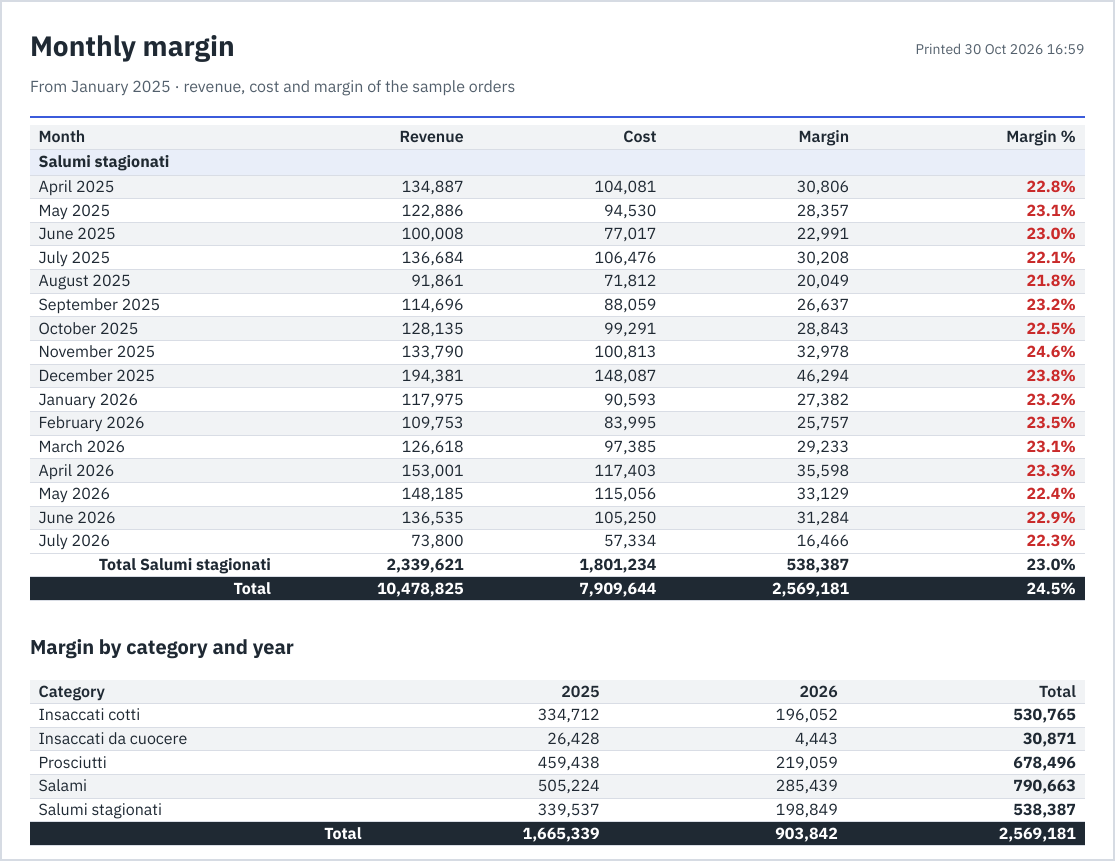
Page 3 of the example: the group carried over from page 2 repeats its label, the rule paints the margins under 30% red, the group's total and the grand total follow; then the matrix, one column per year.
Charts and KPIs
A chart reads its dataset and aggregates it: Along the axis says what the bars,
points or slices are ([region], FORMAT([day], "yyyy-MM")), and each Series is an
aggregate. The server draws the charts, the same in the PDF, on screen and (as images)
in the email.
| Kind | Draws |
|---|---|
| Bar, Column | horizontal bars, vertical columns; stacked if asked |
| Line, Area | one line per series along the axis |
| Pie, Donut | each category's share; values below zero are left out |
| Combo | bars and lines together, each series Drawn as bars or line, on the left or the right axis, with a Format of its values of its own (amounts in euros on the left, a percentage on the right); its axis writes its numbers the same way |
| Waterfall | how each category adds to or takes from a total: rises in green, falls in red, the total last |
| Funnel | stages from the largest to the smallest |
| Treemap | each category as a rectangle sized by its value; with One series per value of, nested |
| Heatmap | a grid of the axis by One series per value of, the colour by the value |
| Scatter | one point per category (X the category, Y the aggregate), or one per row with a value that is not an aggregate |
| Gauge | one value on an arc, with Minimum, Maximum, a Target and coloured Bands |
| Bullet | a bar per category against its Target, over its Bands |
The options: One series per value of (the first series repeated for each value of a
field, up to 24), Stacked, Values on the chart, Legend, Order and Top
(the N largest values of the first series, the rest gathered as «Other»), Minimum,
Maximum, Target (a number or an aggregate), Bands (their limits, 50, 80)
and a Format for the values. With Order «In the data's order» the categories come
as they first appear in the dataset's rows, so the ORDER BY of its SQL decides: sort
the query by the axis (ORDER BY anno_mese) and the months follow one another in time,
whatever they print as ("MMM yy" too); the series of One series per value of and a
KPI's trend follow the same order. «By value, smallest first» and «By value, largest
first» sort the categories by the first series' value instead. With Top, the N
largest are kept and shown in the order chosen. A chart draws at most 2,000 categories:
set Top, or aggregate.
A KPI card shows one aggregate in large type, with its Label and Format; Compared with, another aggregate, adds the change in percent with an arrow and a colour; Show the trend under the value draws a sparkline of an aggregate Along a field.
The new kinds (combo, waterfall, funnel, heatmap, gauge, bullet, the KPI card) are in the Viewer's and the assistant's charts too: see Preview and analysis.
The viewer
A click on a report in Explore opens it for reading. The bar at the top has one field
per parameter, as the report defines it: a list for those with choices («Any» for an
optional one), a date picker, Yes or No, several values for a list; * marks a required
one. The fields open with the defaults. An optional field emptied has no value, whatever
its default; a required one asks for a value. View report renders it.
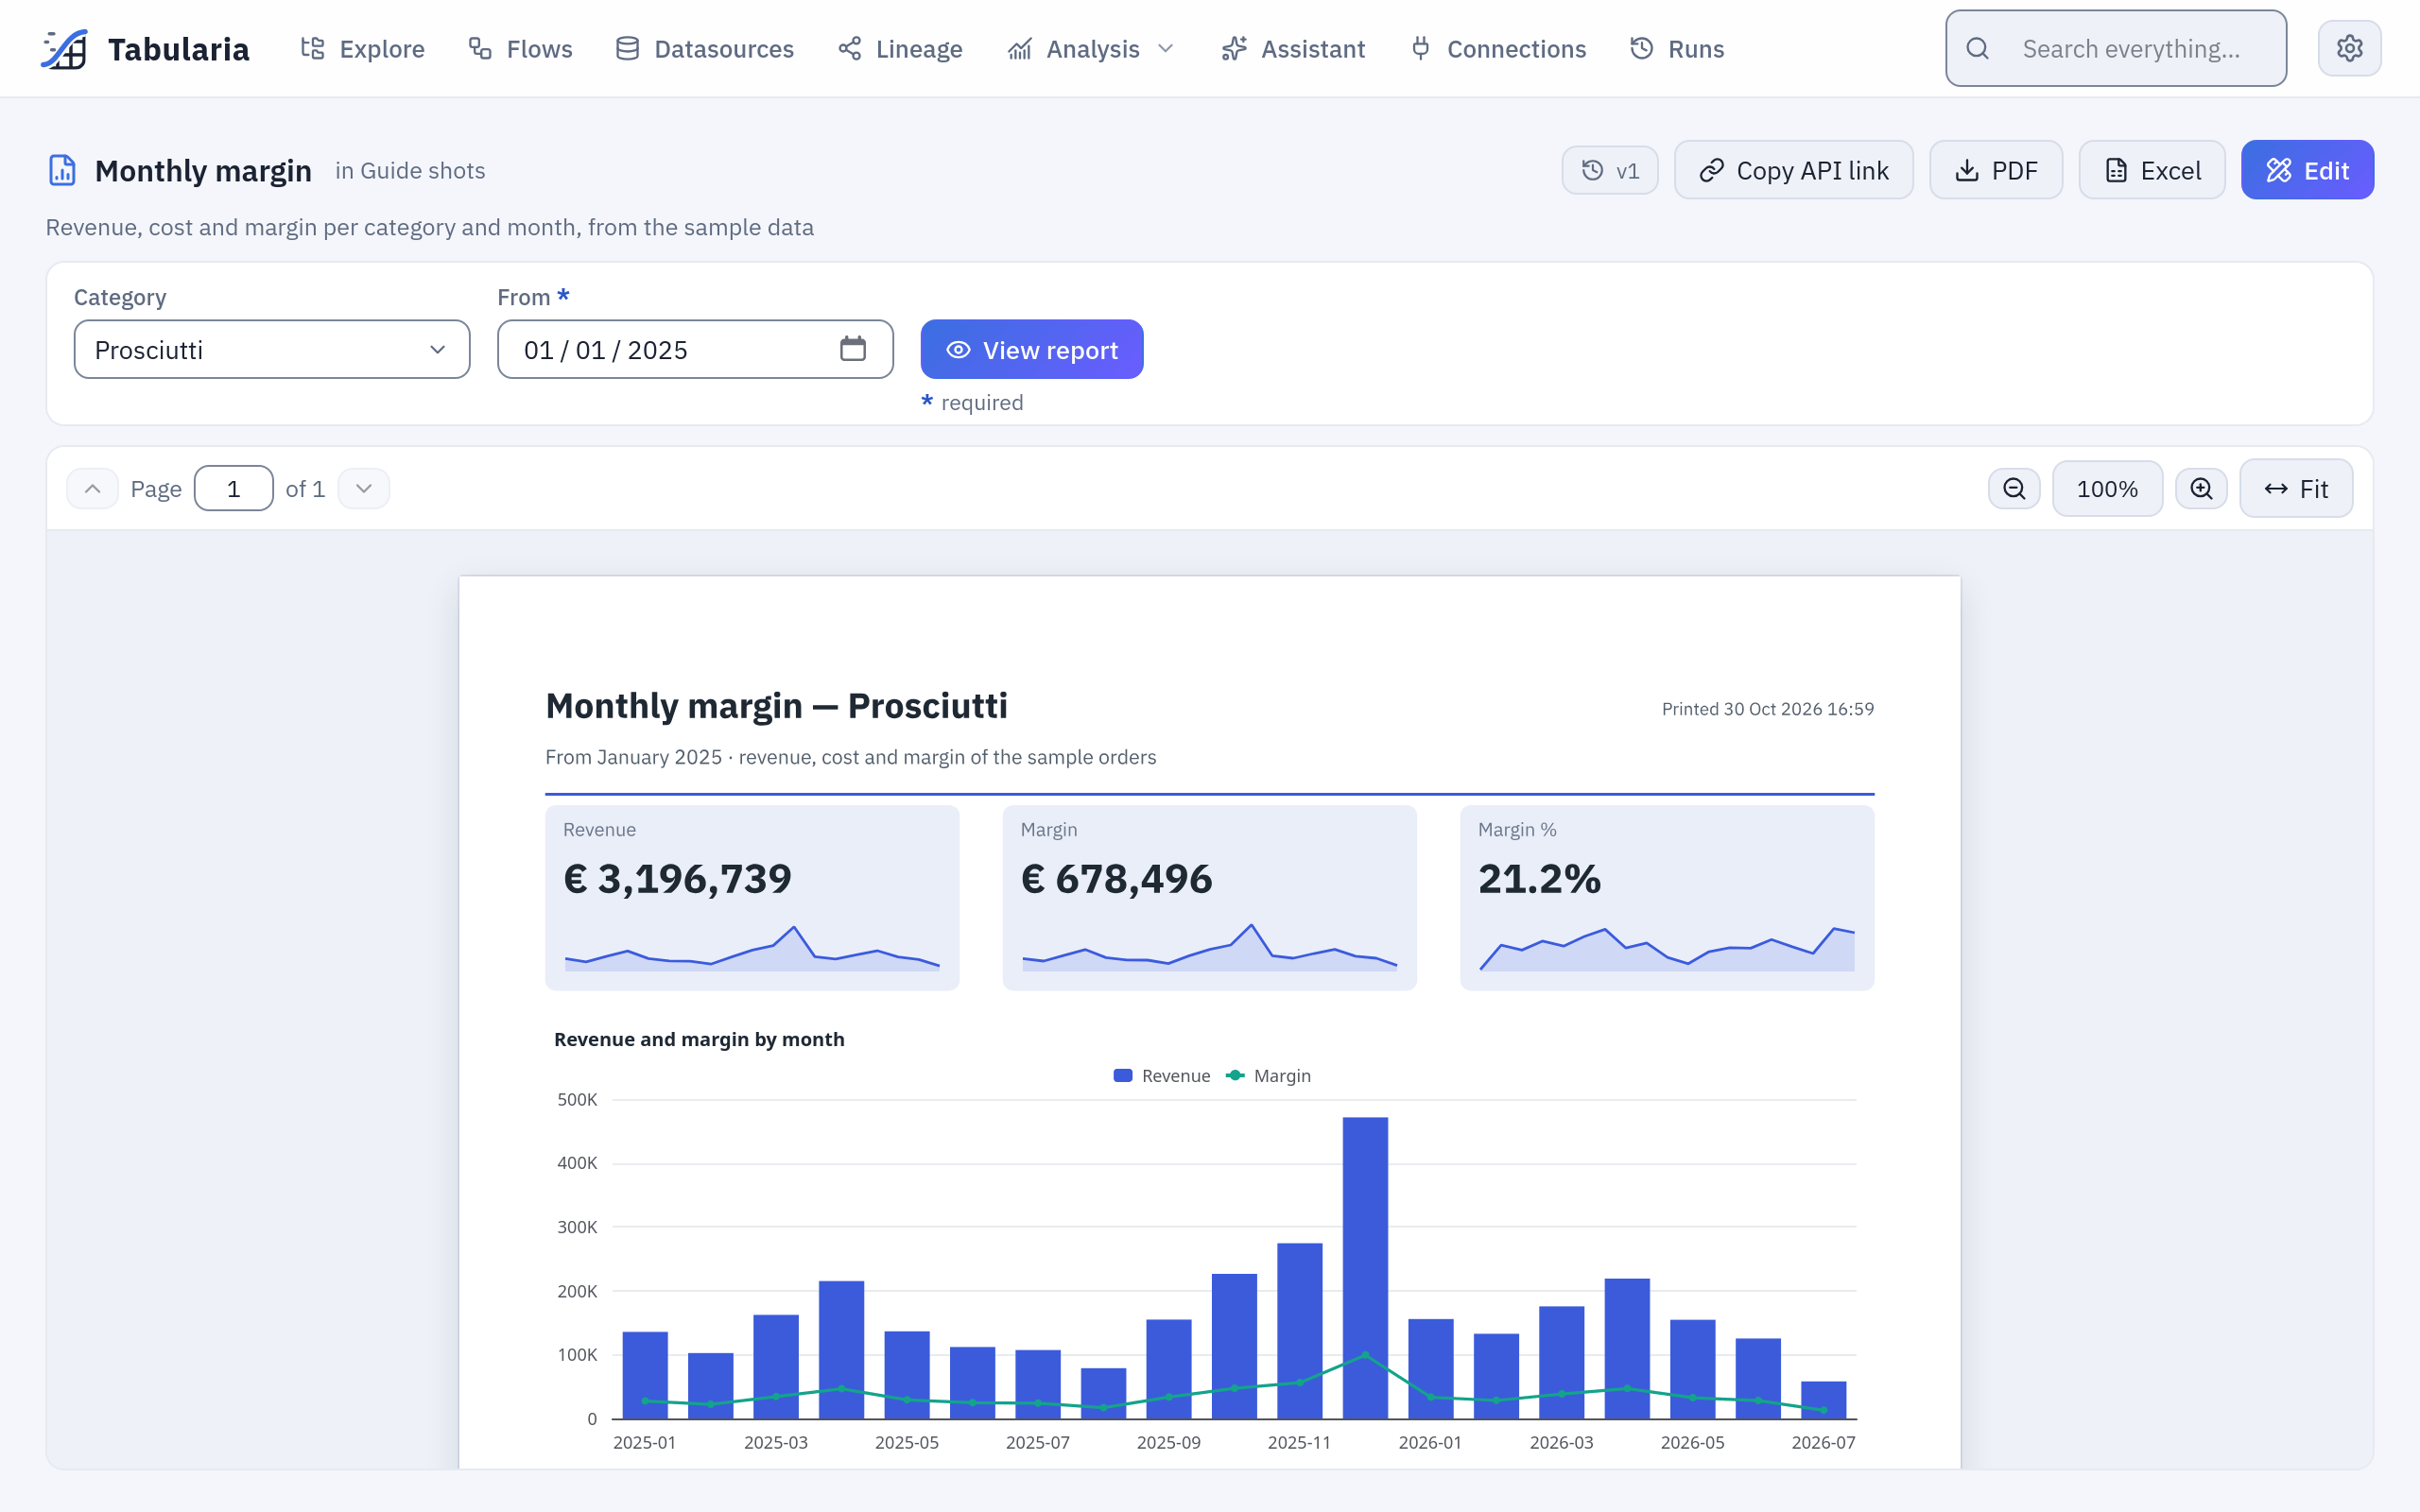
The example with Category Prosciutti: the title says which category, and the KPIs and the chart count only its rows. Above, PDF, Excel, Copy API link, the versions and Edit.
The pages are those of the PDF, drawn by the same renderer, with Page to move
between them (Page Up, Page Down), the zoom (+, −, 0 to fit the
width) and Fit. Where the designer allowed it, a click on a column's header sorts the
table by it (again for descending), unless its value depends on that order, as
PREVIOUS does, and a click on a group's label closes or opens it;
Reset view goes back to the report's own order with every group open. PDF and
Excel download the report as shown: with the values chosen, the sort and the
groups closed on screen. The API, the flow groups and the notebooks render it in its own
order.
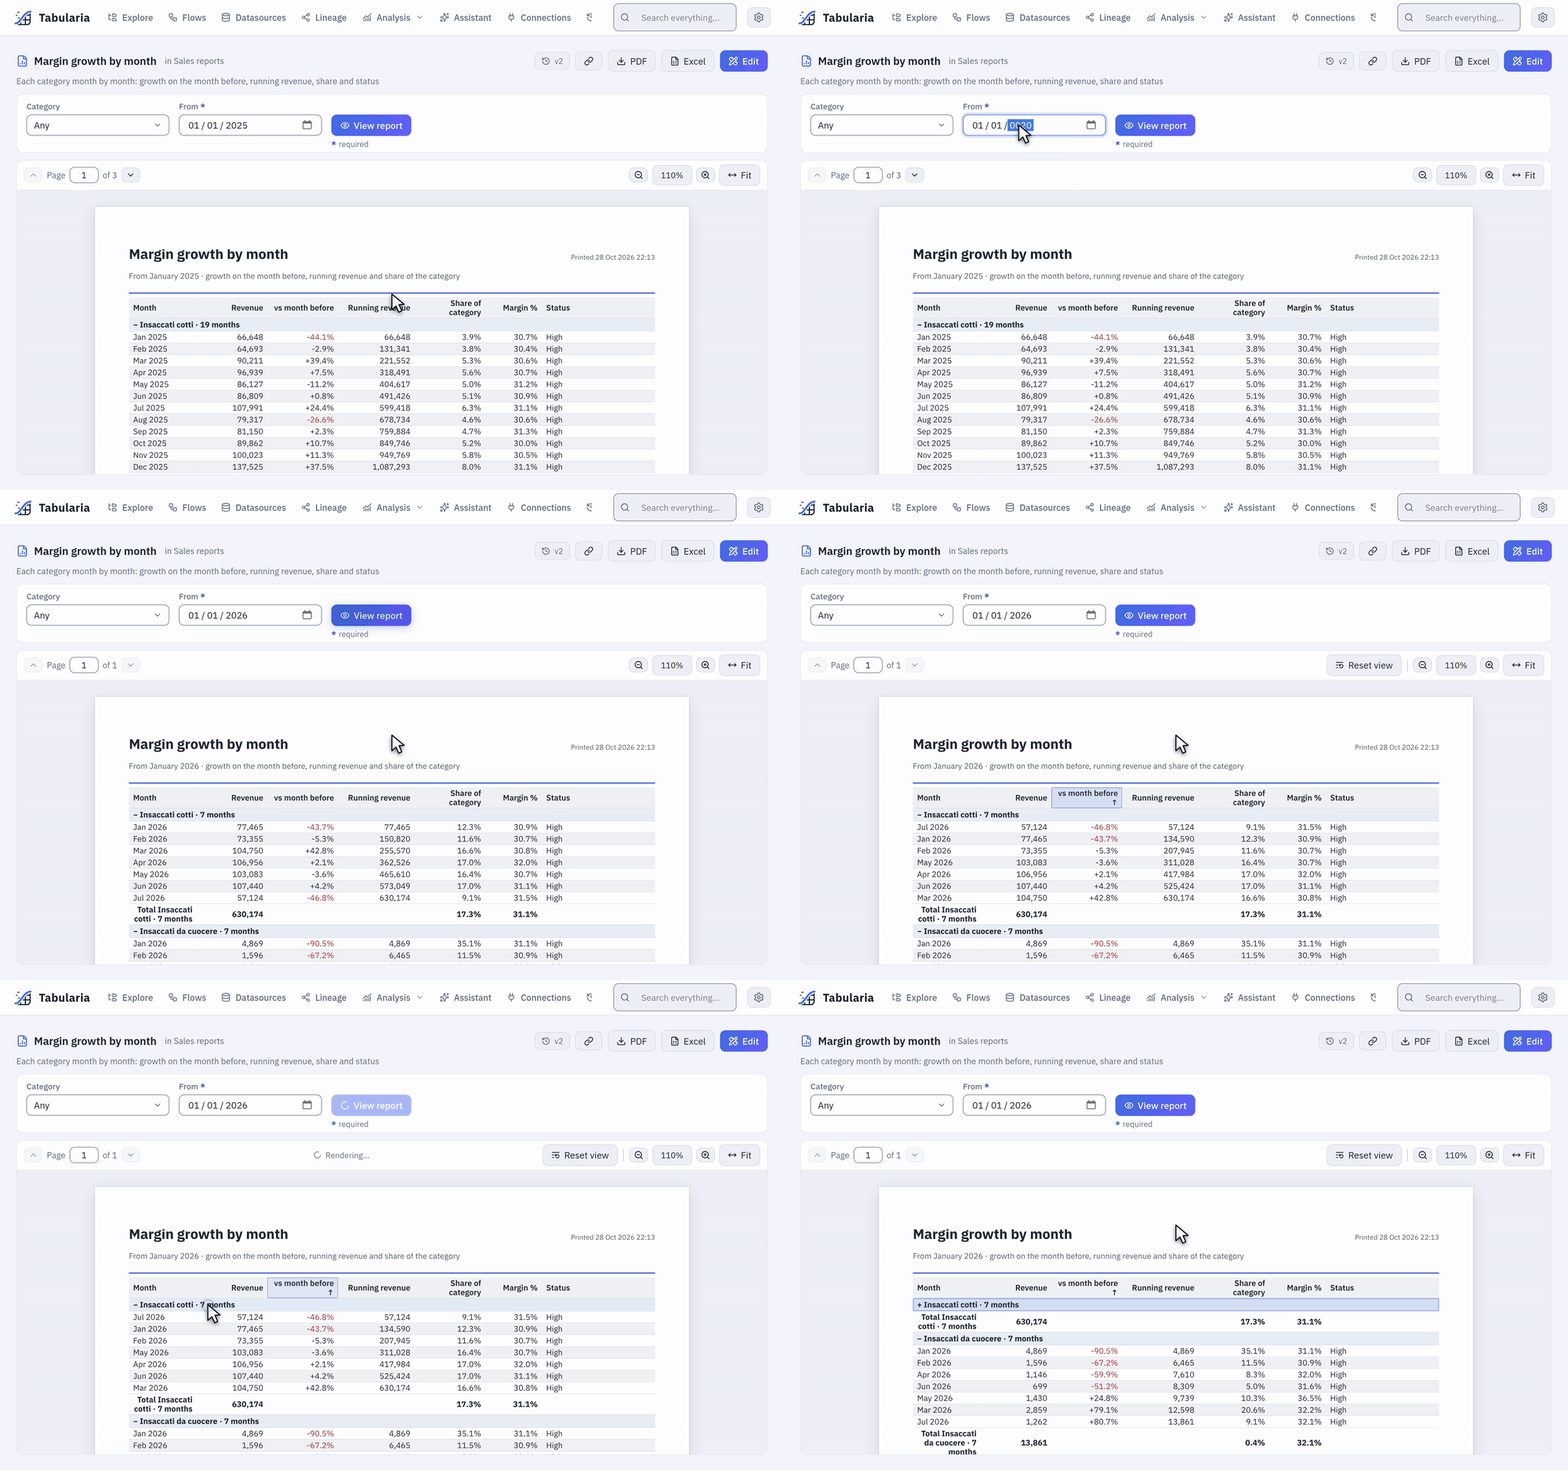
«Margin growth by month» from January 2026: a click on the header vs month before sorts every group by it (the running revenue follows the new order), a click on the group's label closes it to its total; Reset view puts the report back as designed.
The other buttons: Copy API link (the address a script downloads the report from,
with the values on screen that are not the defaults, so a default such as
{today-30} keeps moving with the calendar, and the same as a Python or a curl
example), the versions (every save; who may
edit restores an older one, which becomes the newest), and Edit, which opens the
designer for who may edit. A report that cannot be rendered says why in words: a value
that does not fit, a dataset you may not read, too much data, too many pages, the time
limit.
The Reports tab
Analysis → Reports in the top bar lists every report you may open, from every folder, the most read first; Analysis also holds the Viewer. Each row shows the report's name and description, how many datasets and parameters it has, its folder with the folders above it, its readers, when it was last opened, and when it was last changed, with its version and its author. A click on a row opens it in the viewer; on the right, Open, Edit in the designer (with EDIT on its folder) and Copy API link, the same as in the viewer, with the report's defaults.
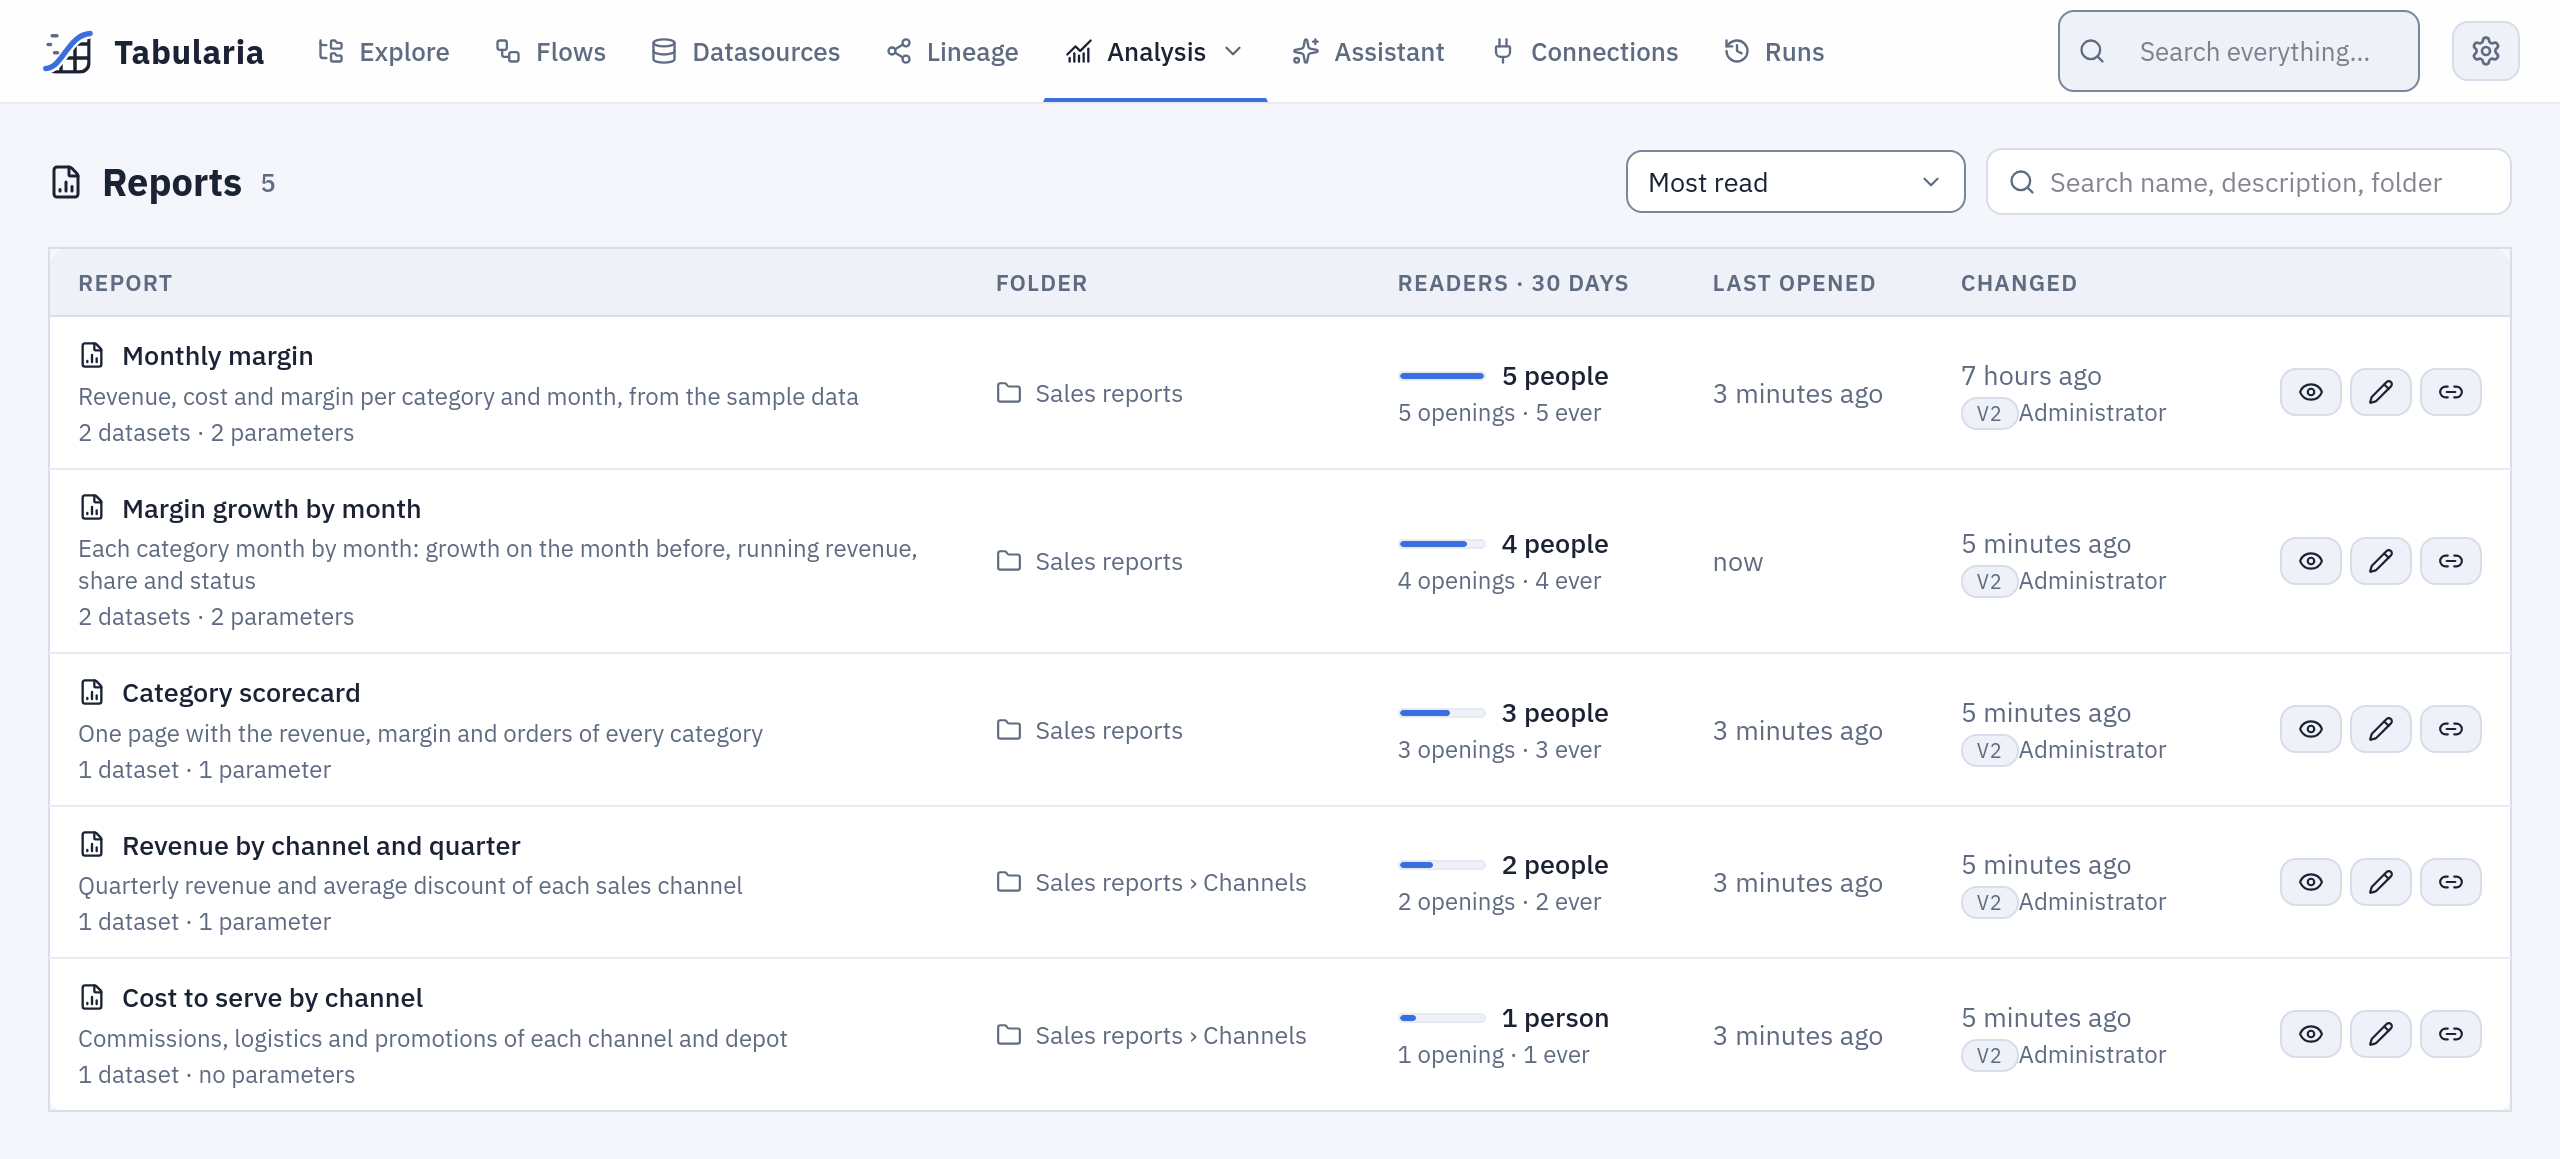
The tab as an analyst with EDIT on Sales reports sees it: «Monthly margin», opened by
five people this month, comes first.
Readers · 30 days is what the default order, Most read, follows: the people who
opened the report in the viewer in the last 30 days, with a short bar against the most
read report of the page. Under it, the openings in those days and the openings ever. A
person counts once a day per report: reloading the page, choosing other values or opening
it from three tabs is still one opening. The day is the installation's (APP__TIMEZONE).
At the same number of people the report opened more times comes first, then the one
opened more times ever, then the one changed last. Name and Recently changed order
the list the other ways.
Only the viewer counts: a download through the API, a flow group's email and a notebook render the report without anyone reading it on screen, and the designer's preview is its author at work. Who opened a report is kept for 30 days and then removed every hour; the report keeps its total and the moment it was last opened. The list never says who read a report, only how many.
The search box looks in the names, the descriptions and the folders: finance finds the
reports of a folder Finance and of every folder inside it. The list shows 50 reports a
page. The order, the search and the page are in the address, so a link or a reload gives
the same list.
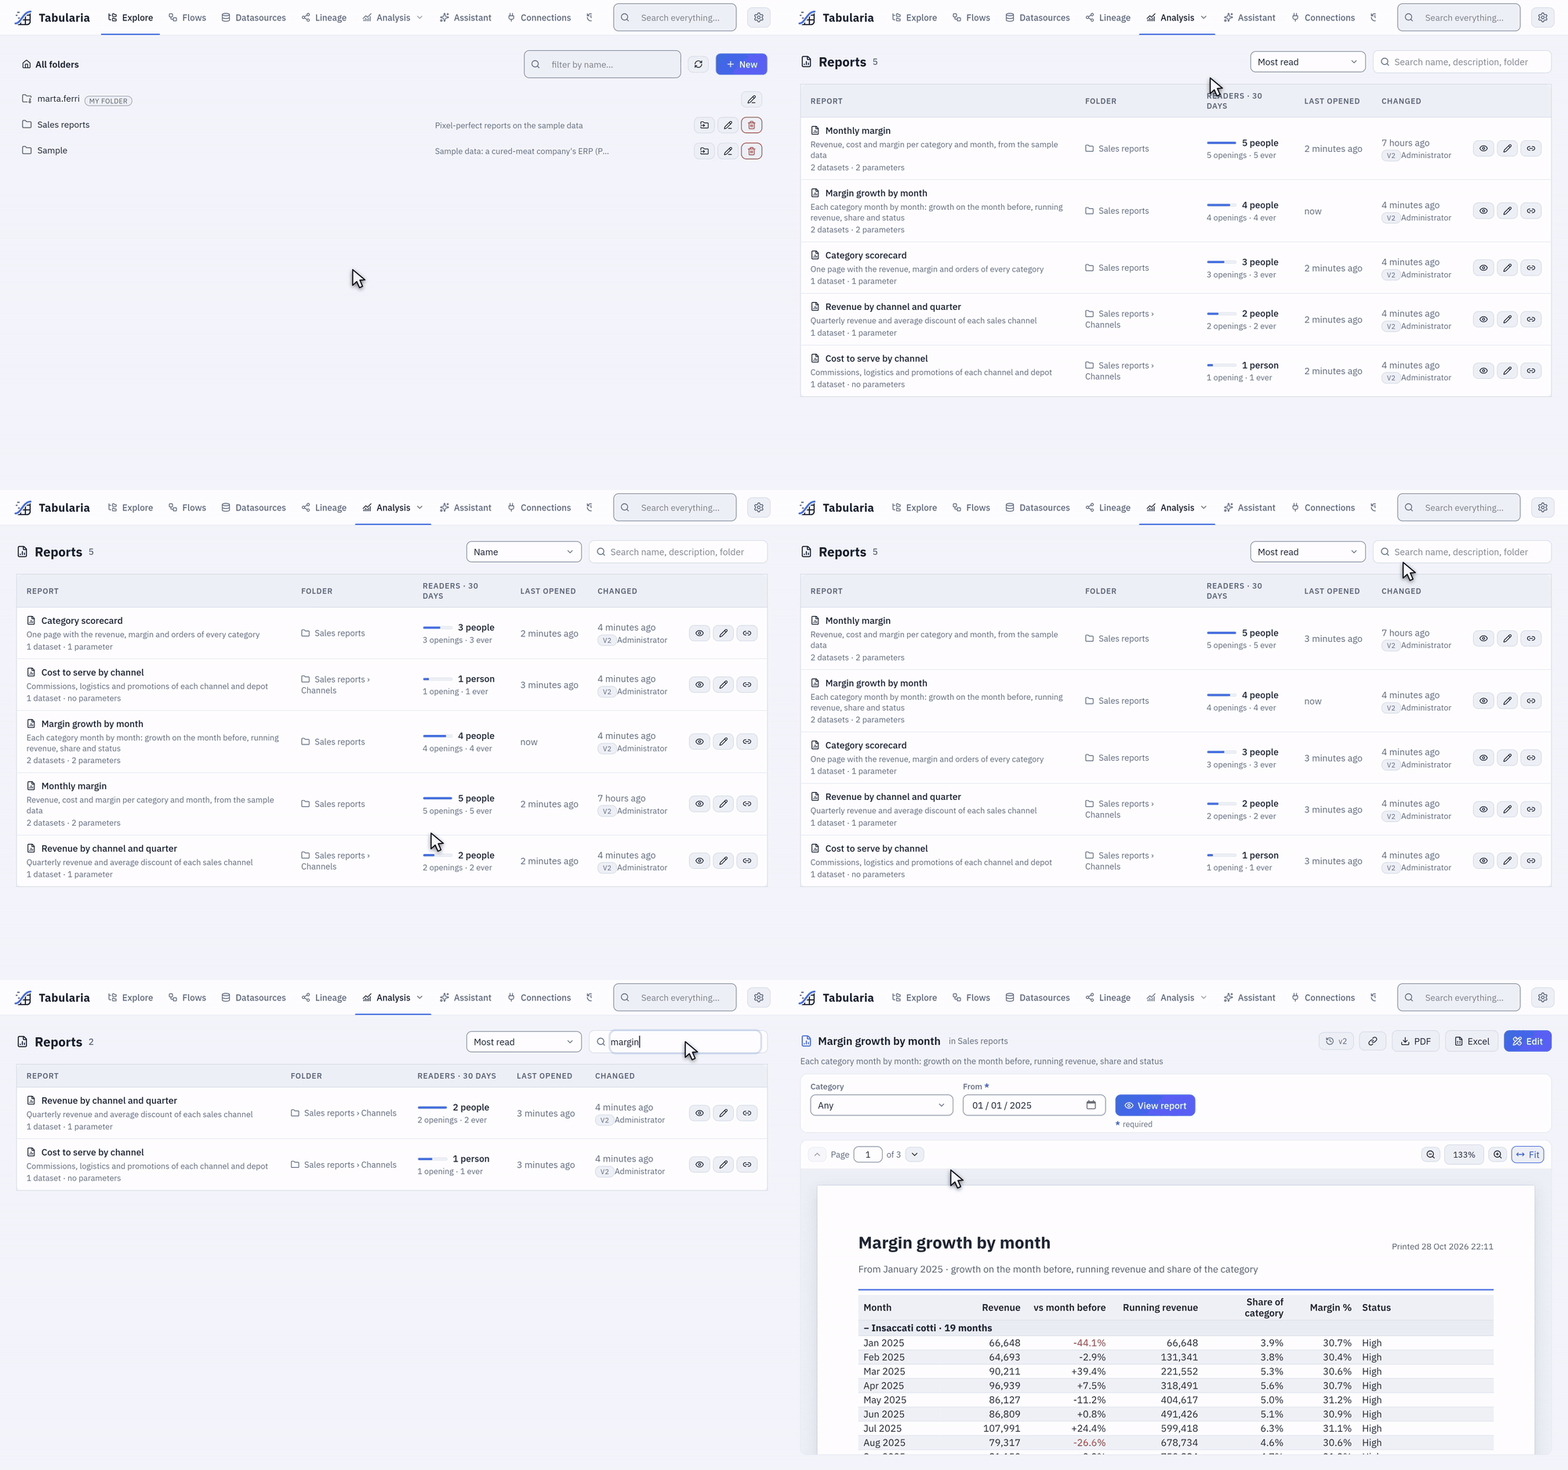
From the Analysis menu: the most read first, then by name; the search finds by
folder (channels) and by name or description (margin); a click on a row opens the
report.
PDF, Excel and the email
| Format | What it is |
|---|---|
| the page as designed: positions exact to a tenth of a millimetre, the font embedded, the header and footer on every page, «Page X of Y». The same data gives the same file | |
| Excel | one sheet per table and matrix (an AI comment has no place in it), named by Sheet name in Excel: the groups as outline levels (closed and opened with Excel's + and −), the subtotals and totals as SUBTOTAL formulas with their values, numbers that stay numbers in the report's formats (a whole number past 16 digits, an id, and a date before 1900 are written as text: a cell of Excel would change the first and cannot show the second), the header frozen and repeated on printed pages, a page break per group where the report has one; one more sheet lists the parameters' values. A text is never turned into a formula |
| the summary in the body of a Pushmail email, 640 pixels wide: the report's texts, its KPI cards, its charts as images and the totals of every table and matrix (below); the detail goes as the attached PDF or Excel |
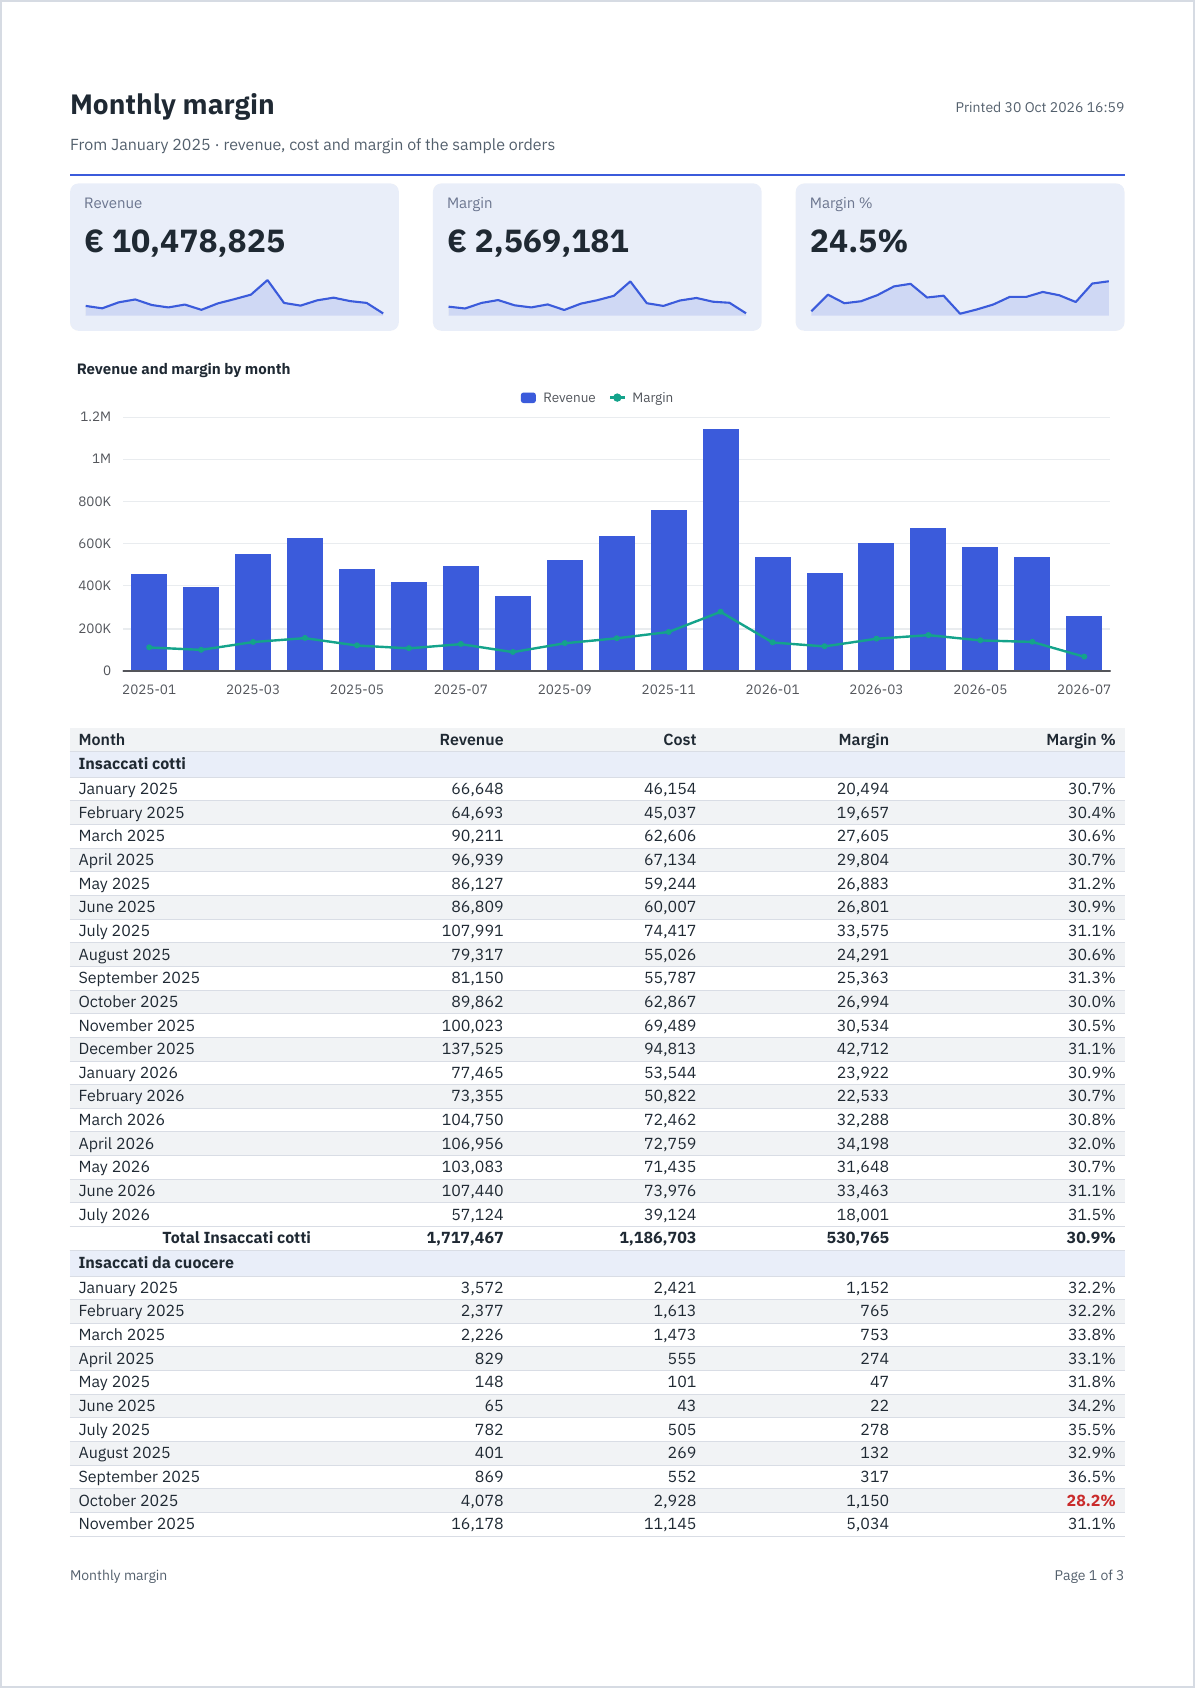
Page 1 of 3 of the example's PDF with every category, from January 2025.
The summary in the email
The summary follows the body of the report, in its order:
- its texts, its KPI cards, its charts and its AI comments, each with its line;
- each table as its totals: the total row of each of its outermost groups and the grand total, with the columns that have a total; a matrix as its rows and its total column. Five columns of values at most fit the width of an email: a wider matrix shows its total column alone, a wider table its first five, and says how many more are in the attached report;
- a table with nothing to total (no group with a total row, no grand total) is left out, and so is the row of texts right above it that introduces it, its title; a table with no text above it is introduced by its Sheet name in Excel, when it has one.
Gmail cuts a message longer than about 100 KB: a long summary shows fewer groups per table («… and 40 more: the whole report is attached»), then leaves out the last tables («2 more tables are in the attached report»). The same summary goes as plain text, a line per total («Total Salami — Revenue 4,854,308 · Margin 1,299,924»), for a mail client that shows no HTML.
Sending it by email
A report is sent only by a flow group: a Pushmail cell attaches it (PDF or Excel, the values of its parameters, the file's name) and can put its summary in the email's body. The cell runs after the steps before it, so the email leaves right after the data it shows has been refreshed, and not at all when a refresh failed.
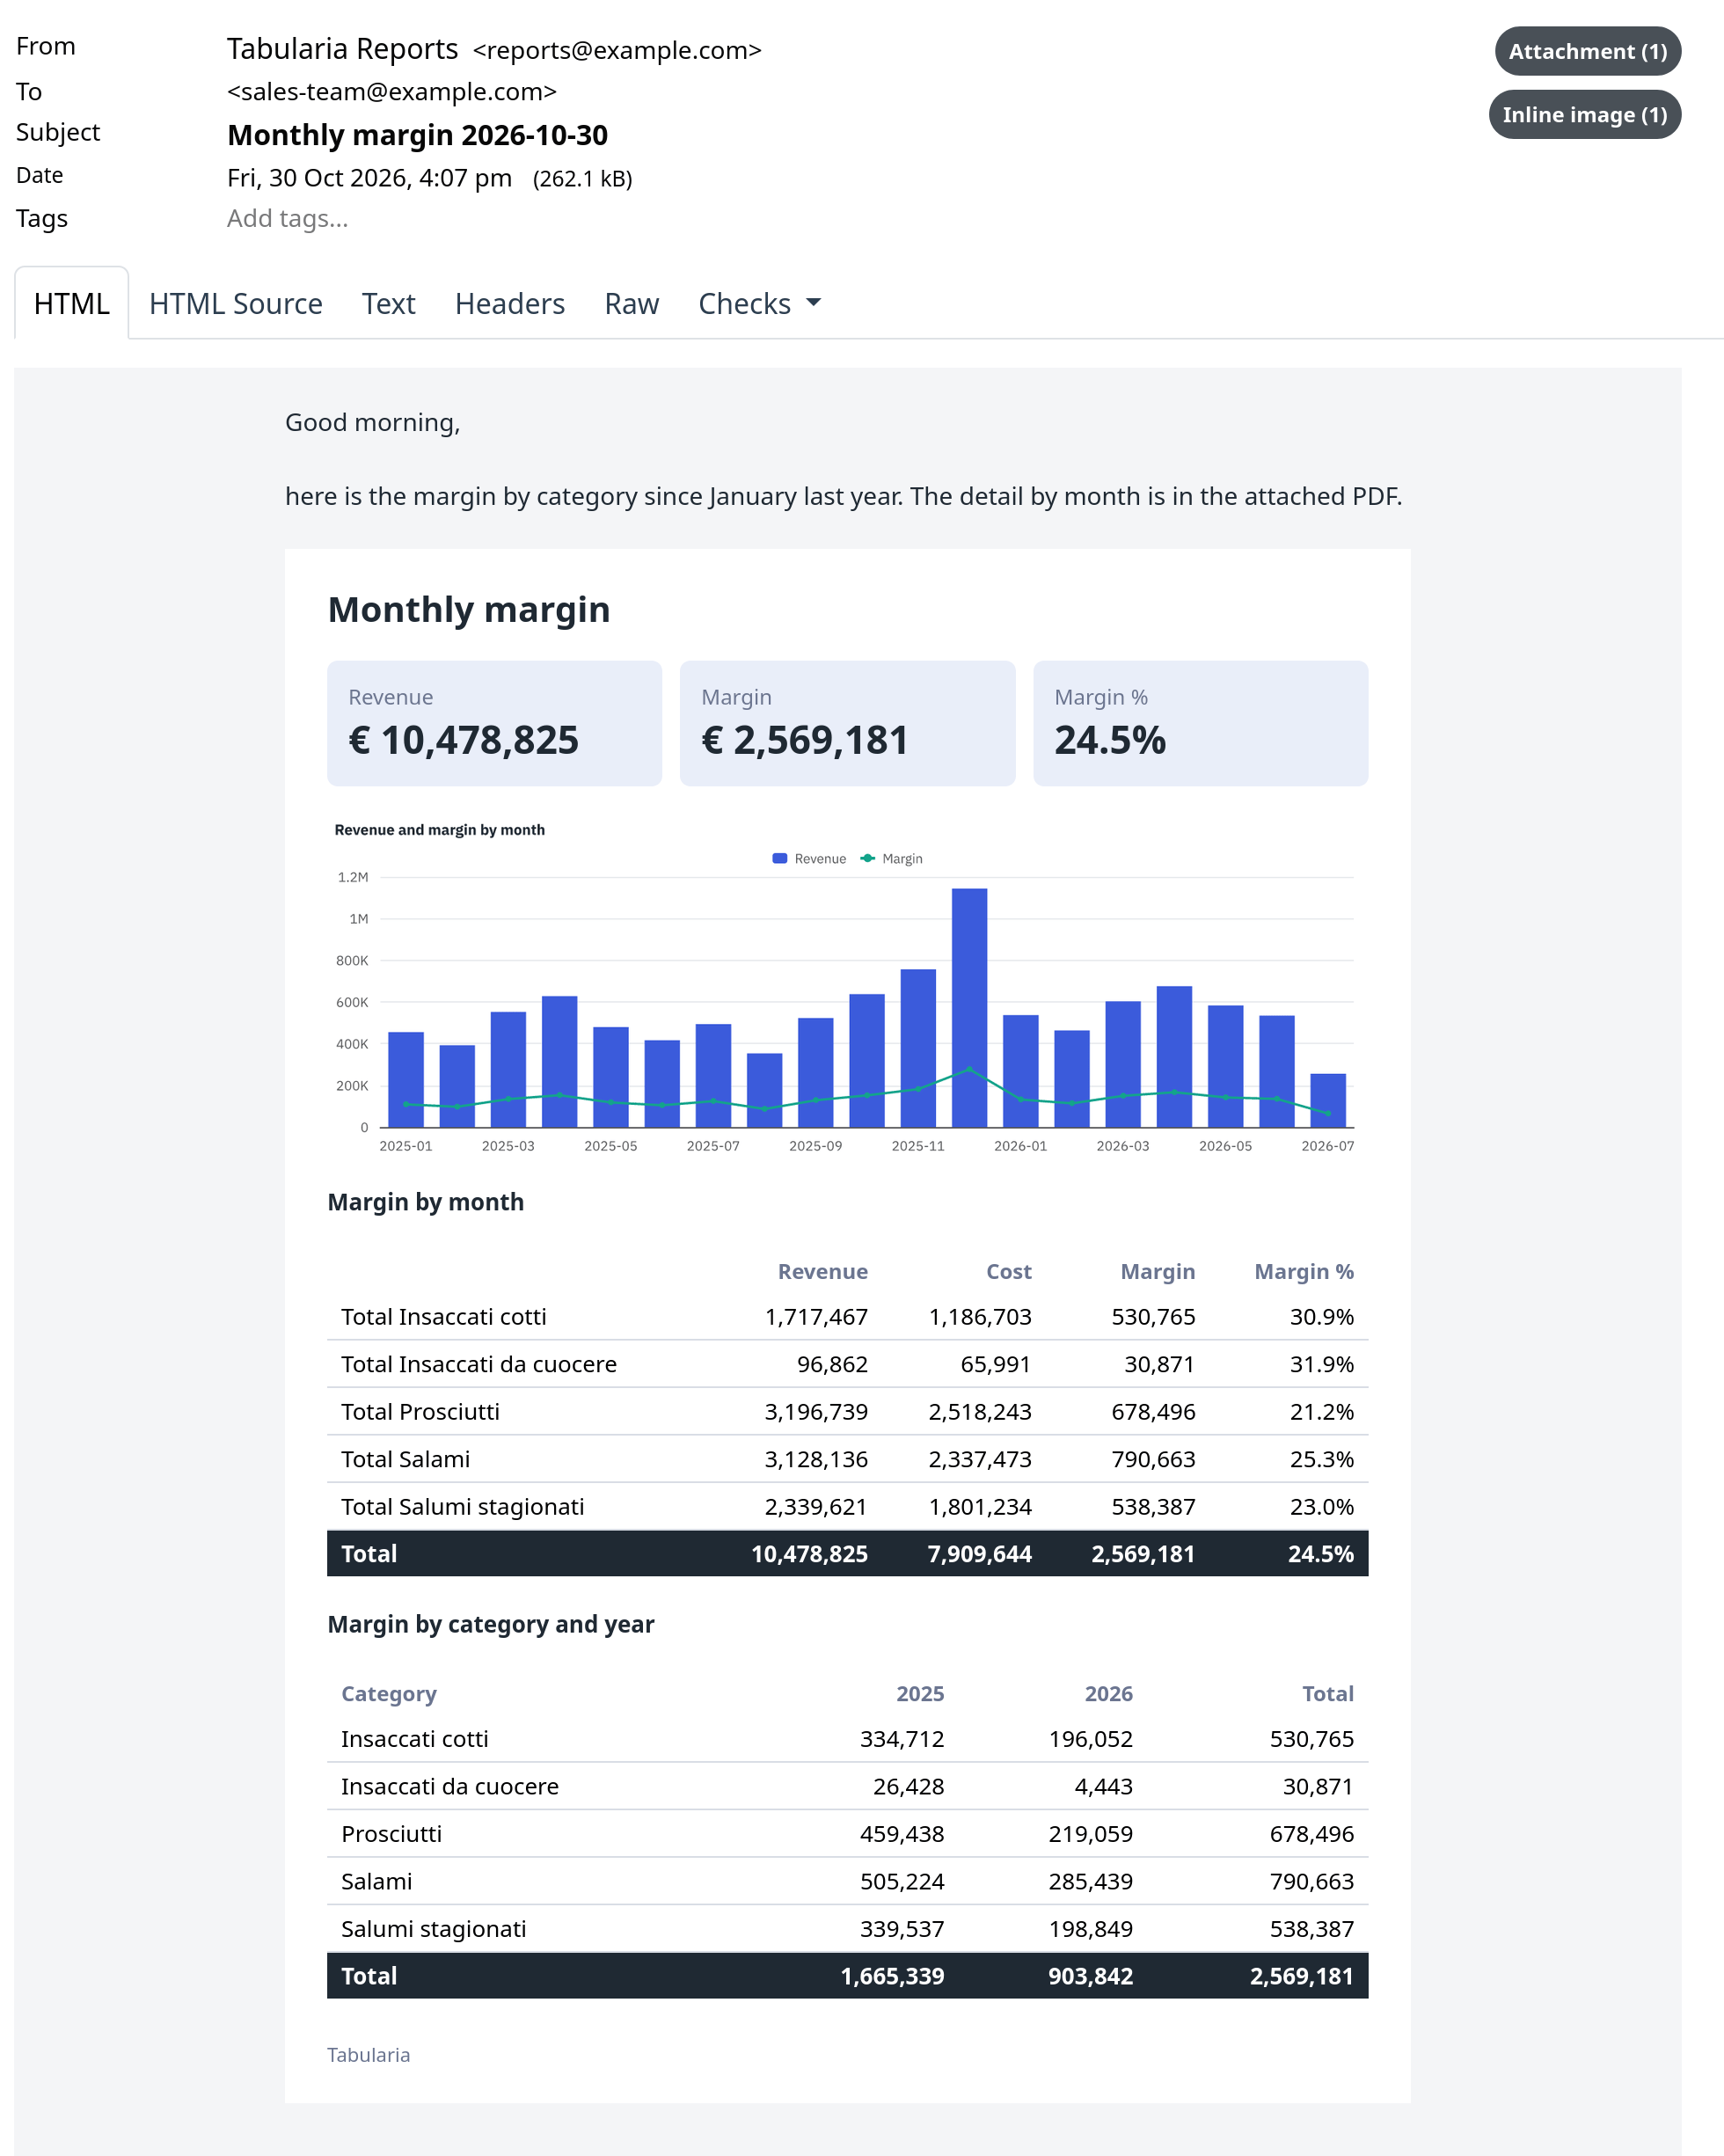
The example sent by a flow group to a test mail server: the cell's message, then the report's summary; the whole report is the attached PDF.
From scripts: the API and notebooks
Any script downloads a report with an API token that may read, with the values of its parameters in the query string:
curl -fG -H "Authorization: Bearer $TABULARIA_TOKEN" -o monthly_margin.pdf \
  --data-urlencode format=pdf --data-urlencode category=Salami --data-urlencode "since={start_of_year}" \
  https://tabularia.example.com/api/reports/12/render
The formats, the errors and a Python example are in the API's
Download a report; in a marimo notebook,
tabularia.report() does the same in one line.
AI comments
An AI comment is a short text written by the configured AI model on the numbers of the KPIs, charts and tables you pick, such as what moved and what stands out. The numbers never depend on it: a provider that is down, a budget that is spent or a mode that forbids it costs the comment only, and the page says so.
To add one, drag AI comment from Insert onto the page, and in its panel write what you ask of it (at most 1,000 characters; empty, it says what stands out) and tick what it reads, from 1 to 10 elements. Its place and size are in millimetres, as for any item, and it is at least 40 mm wide. A longer text makes the box grow and pushes down what is under it, and a very long word breaks at the edge. Try it shows what it writes: it is the only moment the designer asks the model, and the preview shows what Try it wrote and never asks.
| What it reads | the title and the numbers of the elements it reads, as the page writes them: a KPI's value and change, a chart's categories and series, a table's groups and totals, a matrix's rows, with your instruction, in the report's language |
| What it never reads | a row. A table's detail rows and a scatter that is not aggregated stay out, though the page shows them. An element with only those is left out, and with nothing left no call is made: the panel says so. It has no tool to query with, and it reads nothing else |
| When it writes | when the report is opened, or a PDF or a summary made, if those numbers have no comment. The same numbers make one call for everyone, for a day (AI__COMMENT_KEEP_SECONDS); other values of a parameter or data that changed make another |
| How long it waits | at most AI__COMMENT_WAIT_SECONDS (30), with the render behind it. A report without the element waits for nothing, asks nothing, and is the file it always was |
| Who pays | whoever causes the call, under the daily ceilings: who opens the report, the account of an API token that may write, the group's author for a Pushmail cell. A read-only API token, a notebook and an observer cause no call, and get what is kept |
| Excel | it has no place in a workbook, so an Excel asks the model nothing, and the workbook is the same with or without one |
On paper and on screen it is always marked: Written by AI · the model · numbers of the moment they were read, and that it may be wrong. No setting takes that away. The text is plain text, at most 1,500 characters, with no link: nothing in it is ever read as markup, in the PDF as in the email.
When it cannot write, the document goes out all the same, with one line in its place: that
the comment is not available, that the day's spending limit has been reached, that this
installation sends no data to AI models (AI__METADATA_ONLY: nothing is sent and no number is
read for it). Past the wait the text is kept for the next one who asks, and this document says
it is not available: paper does not speak of what is on its way.
The numbers are those on the page. The comment and the pages read the same rows, once from the source for that document. A report also never lends its author's rights: a reader who may not read a dataset gets no pages, as for any report, and so no text. The text kept for someone who reads more is found only by whoever has just read the same numbers.
What its model reads goes where the administrator said: AI in Tabularia.
With whose rights
A report never lends its author's rights. What it reads is checked dataset by dataset with the rights of whoever it is rendered for:
| Rendered | Reads with the rights of |
|---|---|
| in the viewer, in the designer's preview | whoever opens it |
| by a flow group | whoever runs the group: the author of its schedule, for a scheduled run, checked again at every send |
| through the API | the token's account |
| in a notebook | the notebook's session, as its reads |
A dataset the reader may not read stops the render with its name, as one that does not
exist (The dataset «orders»: there is no datasource «Salaries» you can read): two
people may open the same report and one of them gets an explanation instead of the
pages. SQL on a connection needs CONNECT on the connection's folder.
Because a scheduled group sends with its author's rights, someone else who changes what a report reads switches off the schedules of the groups that send it: a dataset added, or one whose SQL, connection, datasource, view or filters changed; a new default of a parameter the group's cell does not set itself; a change to a SQL script or to the filters, computed fields or pivot of a saved view that the report reads; an AI comment added, or one that reads something else or is asked something else, since it spends the author's budget. The audit log says why, and the author schedules the group again after looking. A change of layout, or one made by the schedule's own author, keeps them. A report that a flow group sends cannot be deleted until it is taken out of the group's cells.
The other way round, what a report reads by reference (a saved view, a SQL script, a datasource chosen as such, a connection) cannot be deleted while the report's current version reads it: the refusal names the reports you may see and counts the others. A datasource named in a SQL goes by its name, and is not looked for: the report then says it cannot find it.
The sample reports
The sample data ends with
two finished reports in the Sample folder, to open and to take apart: Analysis → Reports
lists them, and Edit shows how each is made. Nothing in them is typed by hand: each number is read
from the tables of Sample / Private tables, written by the sample flows. Whoever reads them needs
VIEW on Sample.
Margin review
The document for the directors: where the revenue and the margin of a period stand, against the same months a year earlier. It opens on 2025, in two pages; with one Category, in one.
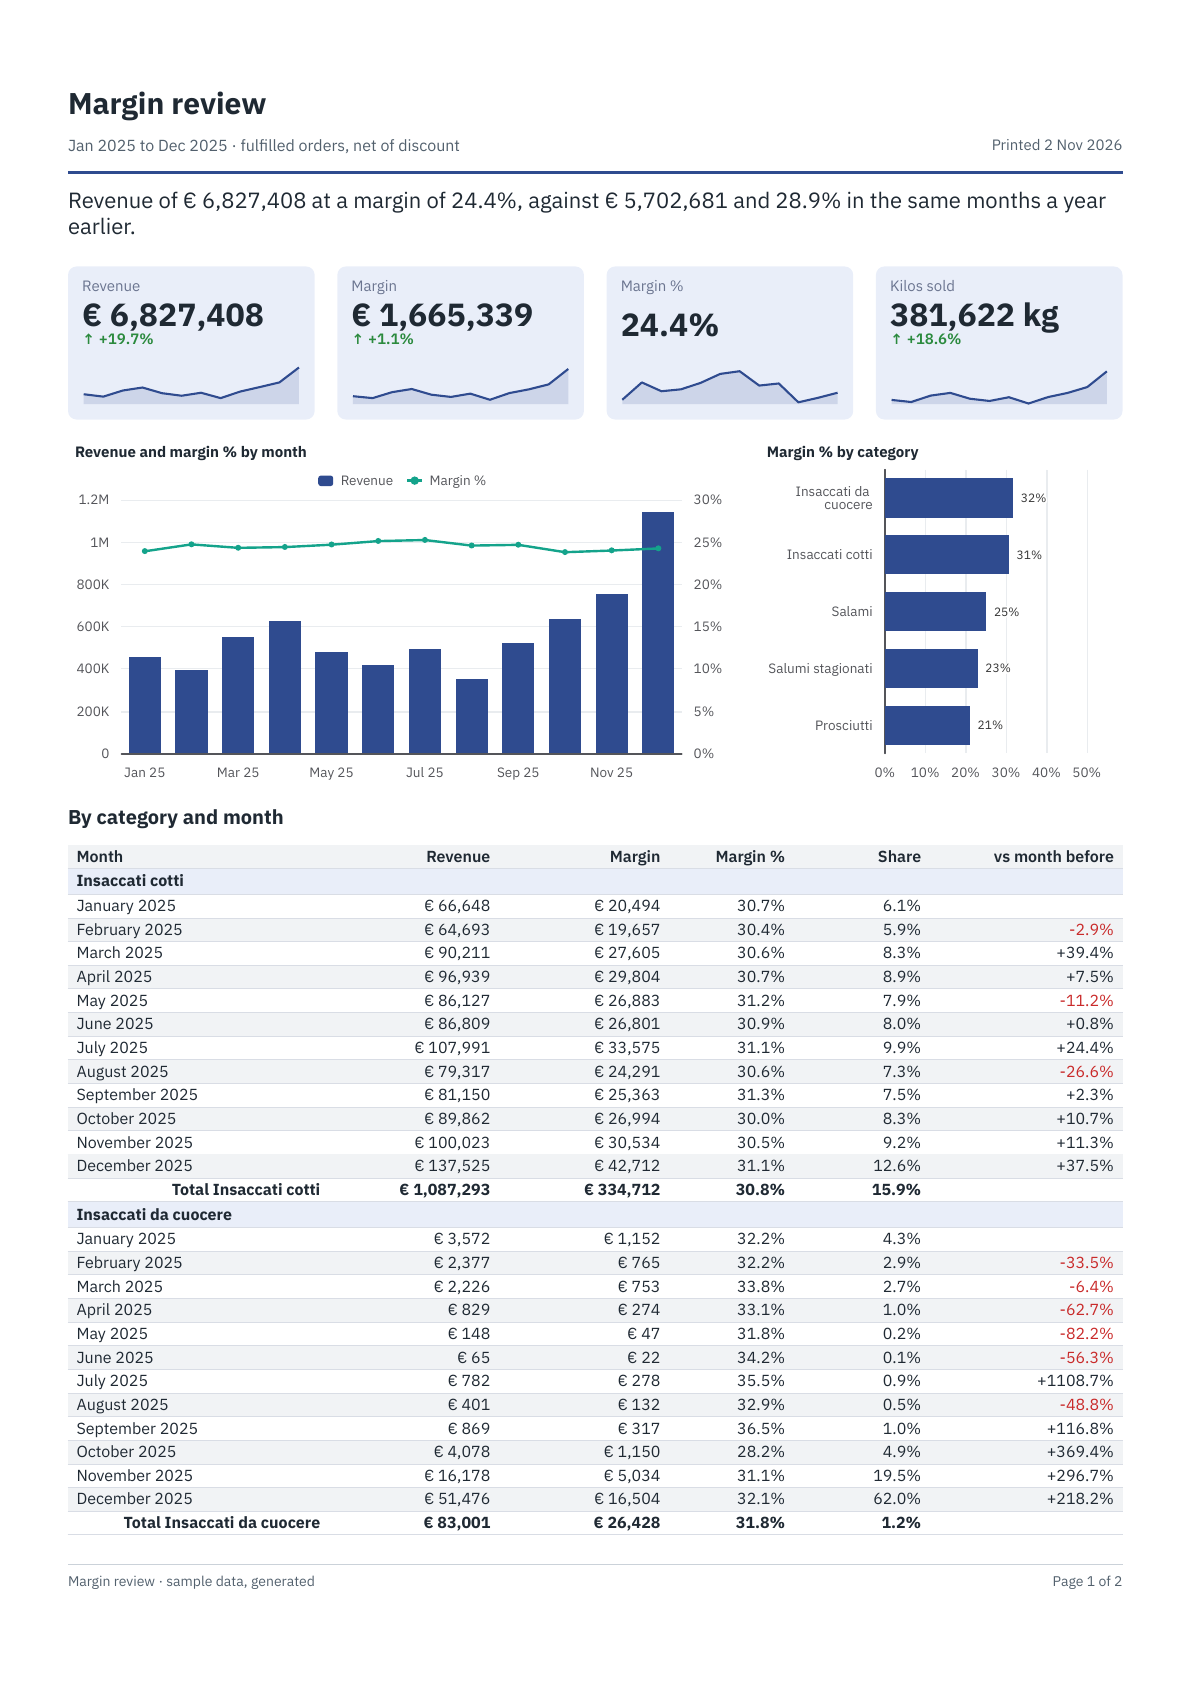
| Look at | To see |
|---|---|
| Category, From, To | three lists on one dataset, months, each filtering it: From shows months with the label FORMAT([Month], "MMMM yyyy") and the value [anno_mese], and To starts where From does, since a list follows those before it |
The dataset history | the same table with the category only, so that a year earlier is there to compare with. A second dataset is how a filter leaves out what a comparison still needs |
| The cards' Compared with | SUMIF([anno_mese] >= PARAM("first_month") - 100 AND [anno_mese] <= PARAM("last_month") - 100, [ricavo], "history"): the same months a year earlier, and inside an IF nothing when the data does not go back that far, rather than half a period |
| The sentence on top | a Text that starts with =, joining FORMAT() of aggregates of two datasets |
| The table's Share | as Value PERCENT(SUM([ricavo]), "categoria"), a month's part of its category; as Total PERCENT(SUM([ricavo])), the category's part of the whole |
| vs month before | [ricavo] / PREVIOUS([ricavo]) - 1, with a Rule that writes the falls in red. A category's first month has none, and the column offers no sort: its value depends on the order |
| The header | =REPORT() & IF(ISNULL(PARAM("category")), "", " — " & PARAM("category")), and the months of the parameters turned into dates |
The data stops on 15 July 2026, so July 2026 is half a month, in the chart and in a comparison.
Agent scorecard
The document for a sales manager: how the agents of an area stand, on revenue and on the contacts of the CRM. Three pages for all of them; choose an Area and the Agent list holds only its agents.
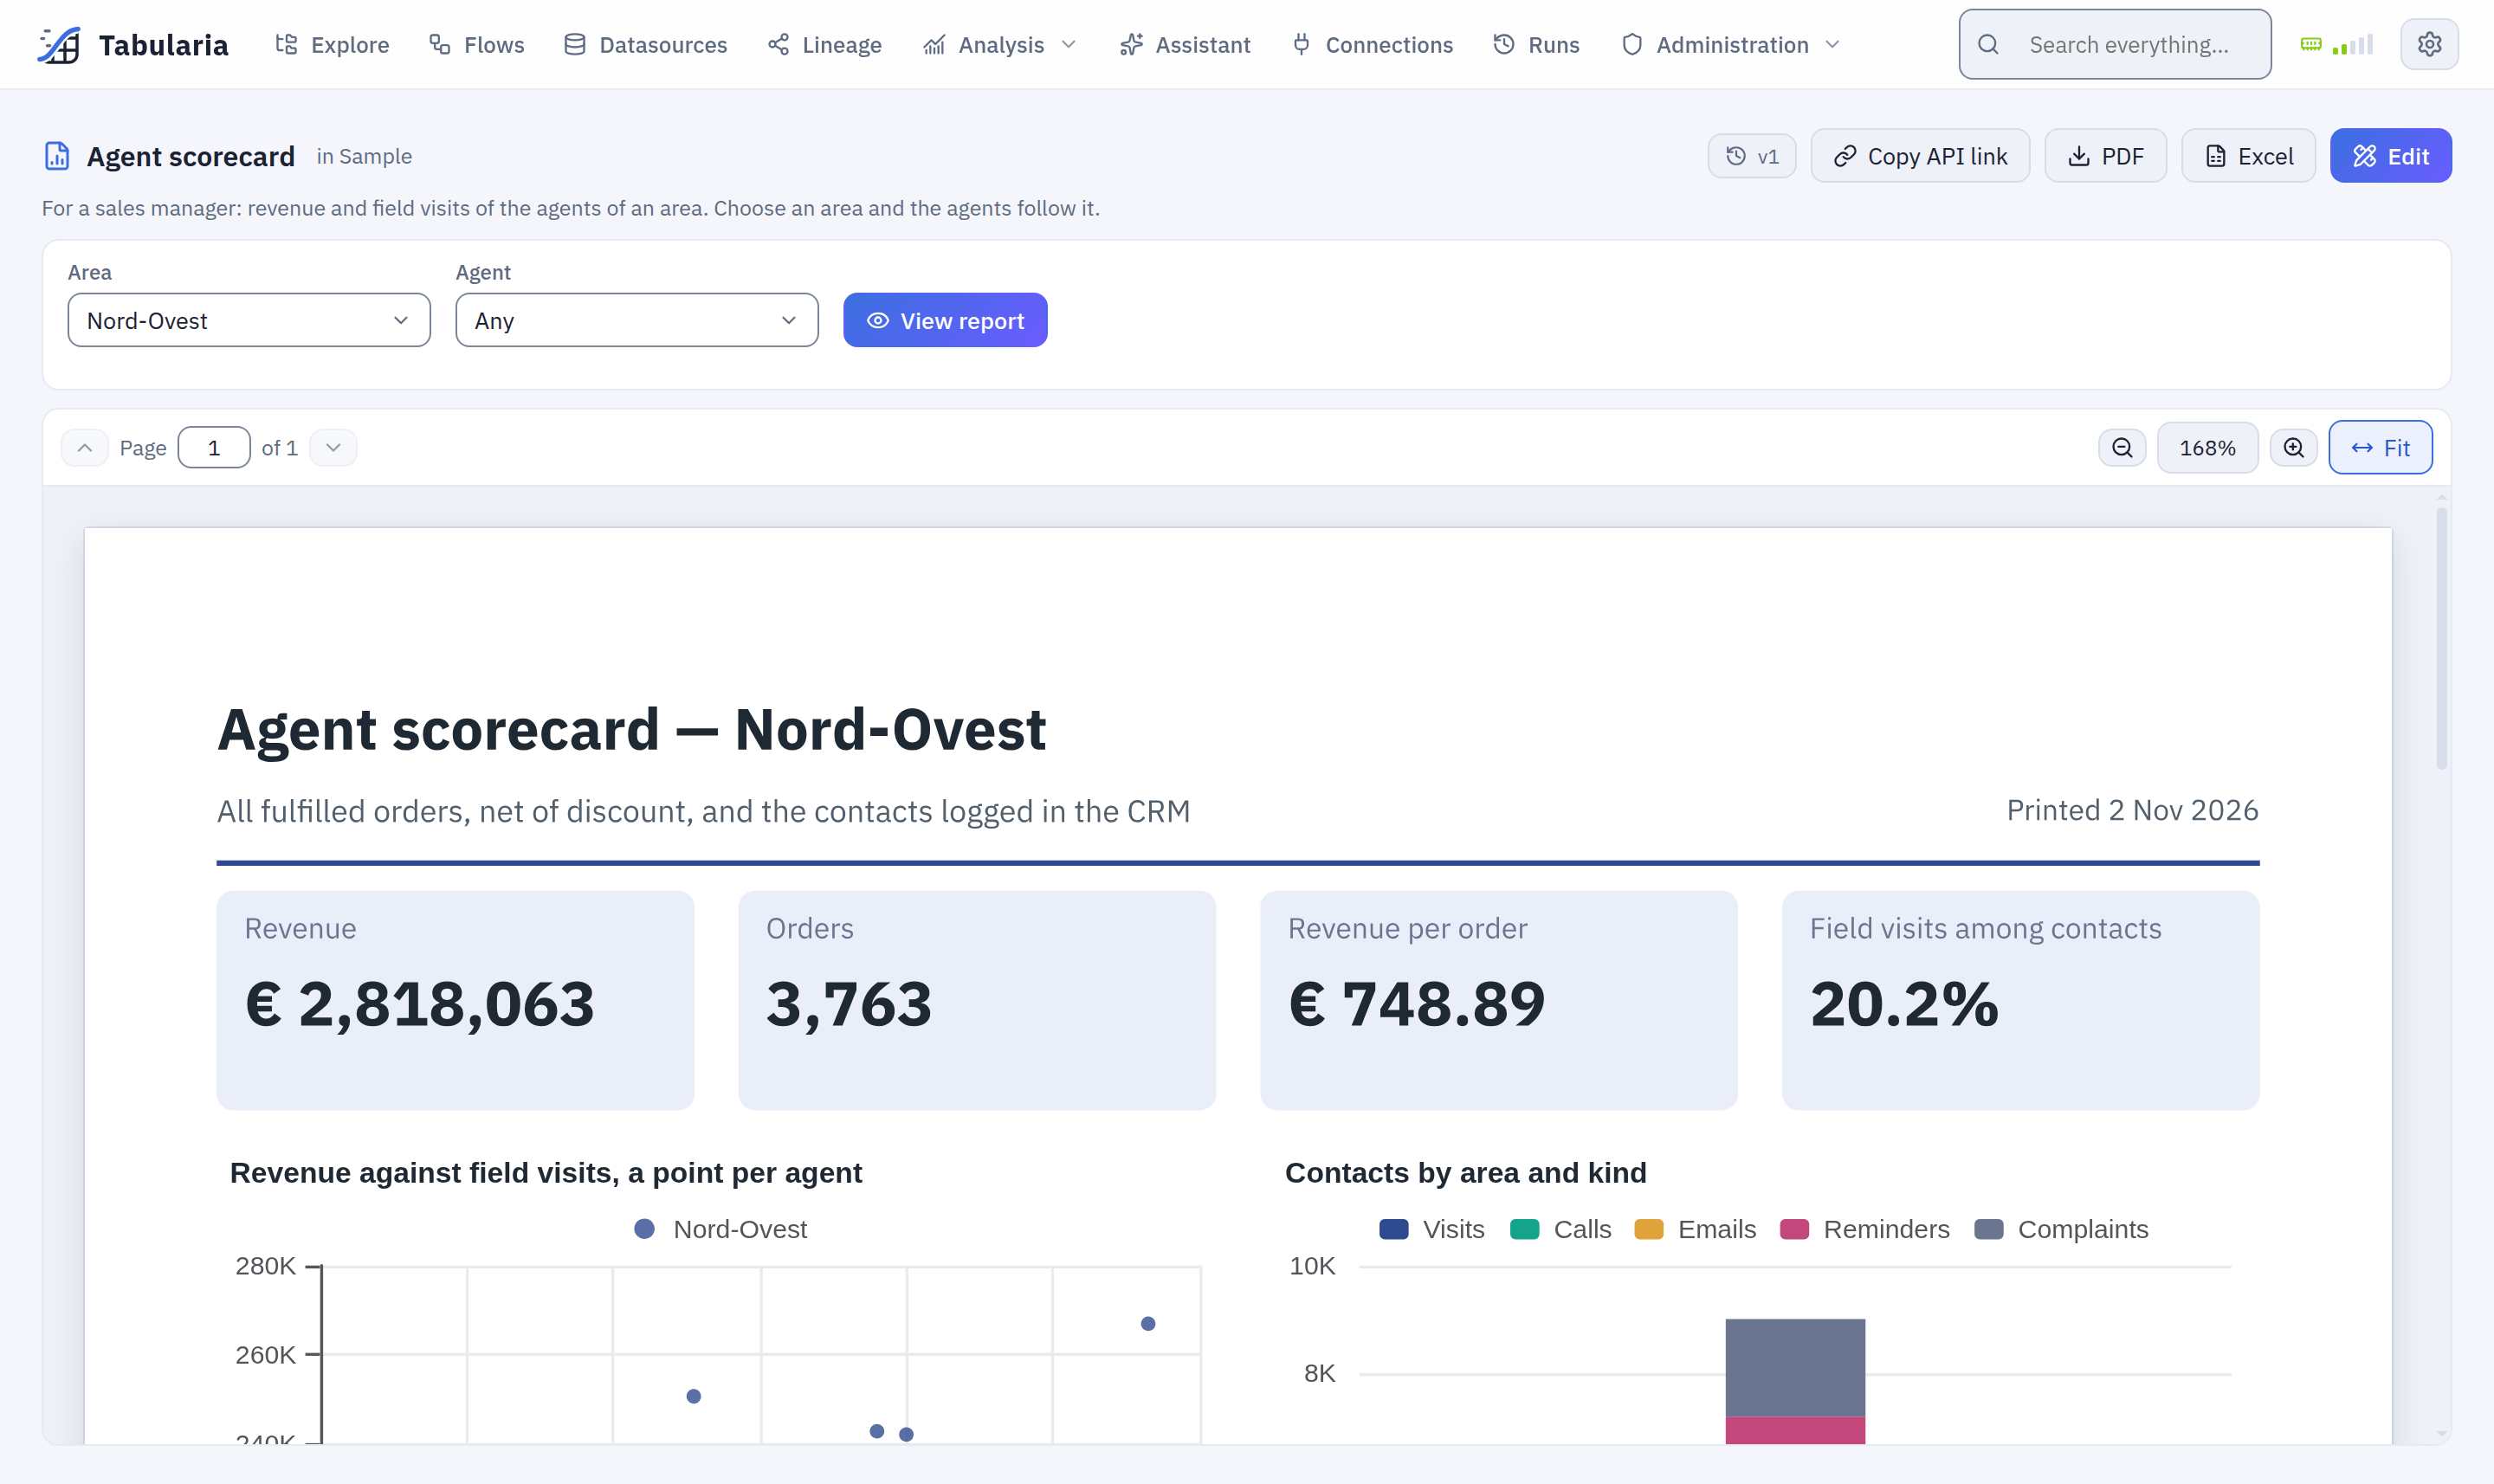
| Look at | To see |
|---|---|
| Area, Agent | two lists that follow each other: both read and filter the dataset agents, in the order of the form |
The calculated fields of agents | Visits and Contacts: LOOKUP([area] & [agente], [area] & [agente], [visita], "crm") reads a second table, with the area in the key as two agents may share a name. Then they are fields like any other, in a card, a chart, a total |
| Size, another calculated field | IFS([ricavo] >= 1.2 * AVG([ricavo]), "Over 120%", …): an aggregate in a calculated field is over the dataset, as chosen in the form |
| The table's Of the area | [ricavo] / SUM([ricavo], "area"), a row's part of its group; the same in the Total, with the grand total left empty because it is in no group |
| Of contacts | two Rules, in red under 18% and in green from 22% |
| The matrix under the table | One column per value of [Size], the columns in the order of the rows, which the table sorts by revenue; Shown when COUNT() > 1 takes it away for one agent |
| Contacts by area and kind | a stacked chart on crm, a dataset with the same two filters: five series, one per field of the table |
To add an AI comment to one of them, as above, duplicate it first: Insert → AI comment, then tick the cards and the table it reads. They come without one because it needs a model: on an installation with none it would say only that it is not available.
A report you change stays as you left it, whatever runs later: the sample container looks it up by name and writes nothing over it. One you delete comes back as it was the next time the container runs.
Example: a monthly margin report
With the sample data (the «Sample» folder):
a report on the datasource «Margin by Category and Month» (in Sample / Private tables,
written by the sample flow of the same name), with the revenue, cost and margin of each
category month by month, a chart and three KPIs on top, and a choice of category and of
the first month.
- The report. In Explore, in a folder of yours (here
Sales reports), New → Report. In the designer, writeMonthly marginover «New report». In Page setup keep A4 portrait with margins 15 · 12 · 15 · 12, set the language English, the time zoneEurope/Romeand the font size 8. - The first month. Data → + Parameter: name
since, labelFrom, type Date, Required, default{start_of_year-1y}(the first of January of last year, at every render). - The data. + Dataset: name
margins, SQL, Runs on Datasources, engine DuckDB:SELECT categoria, anno_mese, ricavo, costo, margine FROM "Margin by Category and Month" WHERE anno_mese >= EXTRACT(YEAR FROM {since}) * 100 + EXTRACT(MONTH FROM {since}) ORDER BY categoria, anno_mese{since}becomes a date, andanno_meseholds months as202501. Add two Calculated fields:Month,DATE(FLOOR([anno_mese] / 100), [anno_mese] - FLOOR([anno_mese] / 100) * 100, 1), the first day of the month as a date; andMarginPct,IF([ricavo] = 0, NULL, [margine] / [ricavo]). Add: the fields are read from the data. - The category. + Parameter: name
category, labelCategory, type Text, not required, no default, Choices → From a dataset:margins, value and label[categoria].marginsis SQL, so the dialog shows the line that filters it by what is chosen: Add, then openmarginsand put that line in itsWHERE, joined to the other condition withAND:SELECT categoria, anno_mese, ricavo, costo, margine FROM "Margin by Category and Month" WHERE ({category} IS NULL OR categoria = {category}) AND anno_mese >= EXTRACT(YEAR FROM {since}) * 100 + EXTRACT(MONTH FROM {since}) ORDER BY categoria, anno_mese
With no category chosen{category}isNULLand every category stays. The list of categories reads the same query without that condition, so it always holds them all. - The page header. A new report starts with a title and a line here, and a page
number in the footer. Click Page header beside the page, select the title and the
line and press Del, then in Insert a Text, Expression:
="Monthly margin" & IF(ISNULL(PARAM("category")), "", " — " & PARAM("category")), size 14, bold. Under it a text="From " & FORMAT(PARAM("since"), "MMMM yyyy") & " · revenue, cost and margin of the sample orders", size 8, grey; on the right the ready-made Date and time of printing; a Line across, 0.4 mm, in the accent colour. Header height 17 mm. - The KPIs. Click Body, then three KPI cards side by side, 58 mm wide, on
margins:Revenue,SUM([ricavo]), format€ #,##0;Margin,SUM([margine]),€ #,##0;Margin %,SUM([margine]) / SUM([ricavo]),0.0%. Each with Show the trend under the value along[anno_mese], the same value. - The chart. A Chart, kind Combo, the full width under the cards, title
Revenue and margin by month: along the axisFORMAT([Month], "yyyy-MM"), seriesRevenue,SUM([ricavo]), drawn as bars, andMargin,SUM([margine]), as a line; format#,##0. - The table. A Table under the chart. In Data, drag
Month,ricavo,costo,margineandMarginPctonto it. Openricavo,costoandmargineand choose Sum as their Total. Name the headersMonth,Revenue,Cost,Margin,Margin %; giveMonththe formatMMMM yyyyand the amounts#,##0;Margin %the total Expression…SUM([margine]) / SUM([ricavo]), the format0.0%and a Rule: when[MarginPct] < 0.3, red and bold. Order of the rows:[anno_mese]. + Group:[categoria]. Grand total at the end is already on, from the first total you chose; tick Alternate row shading and both On screen options. The GIF above shows the drag and the group. - The matrix. Under the table a text
Margin by category and year(size 10, bold) and a Matrix: rows grouped by[categoria], One column per value ofYEAR([Month]), Value of the cellsSUM([margine]), format#,##0; tick Total column. The years come in the order of the rows, which the query sorts byanno_mesewithin each category. - The footer. Click Page footer, select the page number it started with and press Del, then add the ready-made The report's name on the left and Page number of total on the right.
- Preview and look at it, then Done: the report is saved and opens in the
viewer. It has three pages; with Category
Prosciutti, one. - PDF downloads it. To send it every month, put it in a flow group after the
refresh of its data: step 1 the flow «Margin by Category and Month», step 2 a
Pushmail cell with the report as PDF, the file name
monthly_margin_{today:yyyyMM}and Summary in the email body; then Schedule the group, for example0 7 1 * *, at seven on the first of every month.
Who reads it needs VIEW on Sales reports and on Sample / Private tables, where the
datasource is; who sends it from a flow group needs, besides, what the
group and the Pushmail cell need.
Permissions
| On the report's folder | You can |
|---|---|
| VIEW | open it, choose its values, read it on screen, download it as PDF or Excel, copy its API link, read its versions |
| EDIT | create it, design and save it, rename, move, duplicate and delete it, restore a version |
Whoever has VIEW only is taken to the viewer when they open the designer's address.
Administrators see every report. Reports show in Explore, with their own icon, in the
search and in the Reports tab. Every save, rename, move, duplicate,
delete and restore is in the audit log (report.create,
report.update…), and so is every render (report.render), with its format, the values of its parameters, the
outcome and where it came from: the interface, the API, a notebook or a flow group.
Limits and good to know
- A dataset reads at most
REPORTS__MAX_ROWSrows (3,000,000 by default): one more stops the render and names the dataset. The query is cut at the source, so aSELECT *on a big table costs no more than that many rows. A report is a document, not an export: aggregate in the SQL where you can. The report works out its groups, totals, charts and KPIs over the rows in columns, with DuckDB: a million rows grouped with their totals take a second or two and some 500 MB of the worker's memory, a thousand totals almost nothing. Shown row by row they would not fit the pages: a table with more rows to show than its pages can hold stops at once and says so. A render makes at mostREPORTS__MAX_PAGESpages (200); its layout runs in a process of its own withREPORTS__RENDER_MEMORY_MBof memory (1024: some 200 pages of tables) andREPORTS__RENDER_SECONDSof time (120). See the configuration. - Charts are drawn by a chart service: the
chart-rendererservice on Docker Compose, a sidecar of the worker pods on Kubernetes. When it does not answer, a report with charts fails and says so; the others still render. - At most 20 datasets and 50 parameters per report, six levels of groups per table, 60 columns per table or matrix, 2,000 categories per chart, an expression of 4,000 characters, an image of 512 KiB.
- The screen is drawn from the same pages as the PDF; sorting and closing groups render it again, which takes as long as a render.
- No subreports and no Word output. A report has no lineage of its own: it writes no dataset. Its schedule is that of the flow group that sends it.
Related
- Report functions: every function with examples on the sample data
- Dashboards: the same datasets and parameters, on a screen that answers clicks
- Pushmail: sending a report from a flow group
- Flow groups and Scheduling
- API: download a report, marimo notebooks
- SQL scripts, Preview and analysis
- Date placeholders
- Configuration: reports