Concepts
Tabularia is a workspace of folders that hold connections, datasources, flows, scripts and flow groups, with permissions set on the folders. This page is the mental model in one place, for anyone arriving: what each object is, how they work together, who may do what, and which services run behind them. Every section points to the page that goes into detail.
At a glance
| Object | What it is | Lives in | More |
|---|---|---|---|
| Folder | A node of the workspace tree; carries the permissions | Explore | Permissions |
| Connection | The address and credentials of a database, SFTP server, S3 bucket, HTTP API, SharePoint site or SMTP server | a folder | Connections |
| Datasource | A named table of the catalog: a parquet snapshot in the object storage | a folder | Sources |
| Flow | A pipeline drawn on a canvas: source nodes, operations, Output nodes | a folder | Flows |
| Saved view | A Viewer configuration (filters, pivots, charts) over a datasource; never the rows | a folder | Preview and analysis |
| Script | Python or R code with its versions, run on Kubernetes | a folder | Python and R |
| SQL script | SQL over the catalog or over a database connection | a folder | SQL scripts |
| Report | A paginated, pixel-perfect document over datasets, with parameters: read on screen, downloaded as PDF or Excel, sent by email | a folder | Reports |
| Dashboard | A screen of live tiles on a grid, over datasets, with parameters: a click on a chart filters the others; downloaded as PDF or image, sent by email | a folder | Dashboards |
| Flow group | Flows, refreshes, scripts, SQL scripts, images and emails in steps | a folder | Flow groups |
| Run | One execution, with its outcome, timings, engine and log | the Runs page | below |
| User, group, service account | Who signs in or calls the API, and how they are grouped | Administration | Permissions |
Folders and permissions
Everything lives in a folder, and folders nest. Explore shows the tree: a folder
lists its subfolders, flows, datasources, views, connections, scripts, SQL scripts,
notebooks, reports, dashboards and flow groups.
Root folders are created by administrators; a subfolder by whoever has MANAGE on
its parent. Every person also has a personal folder, born with their account and
named after their email (leonardtriv for leonardtriv@example.com): first in Explore as
My folder, seen only by them and the administrators
(Personal folders).
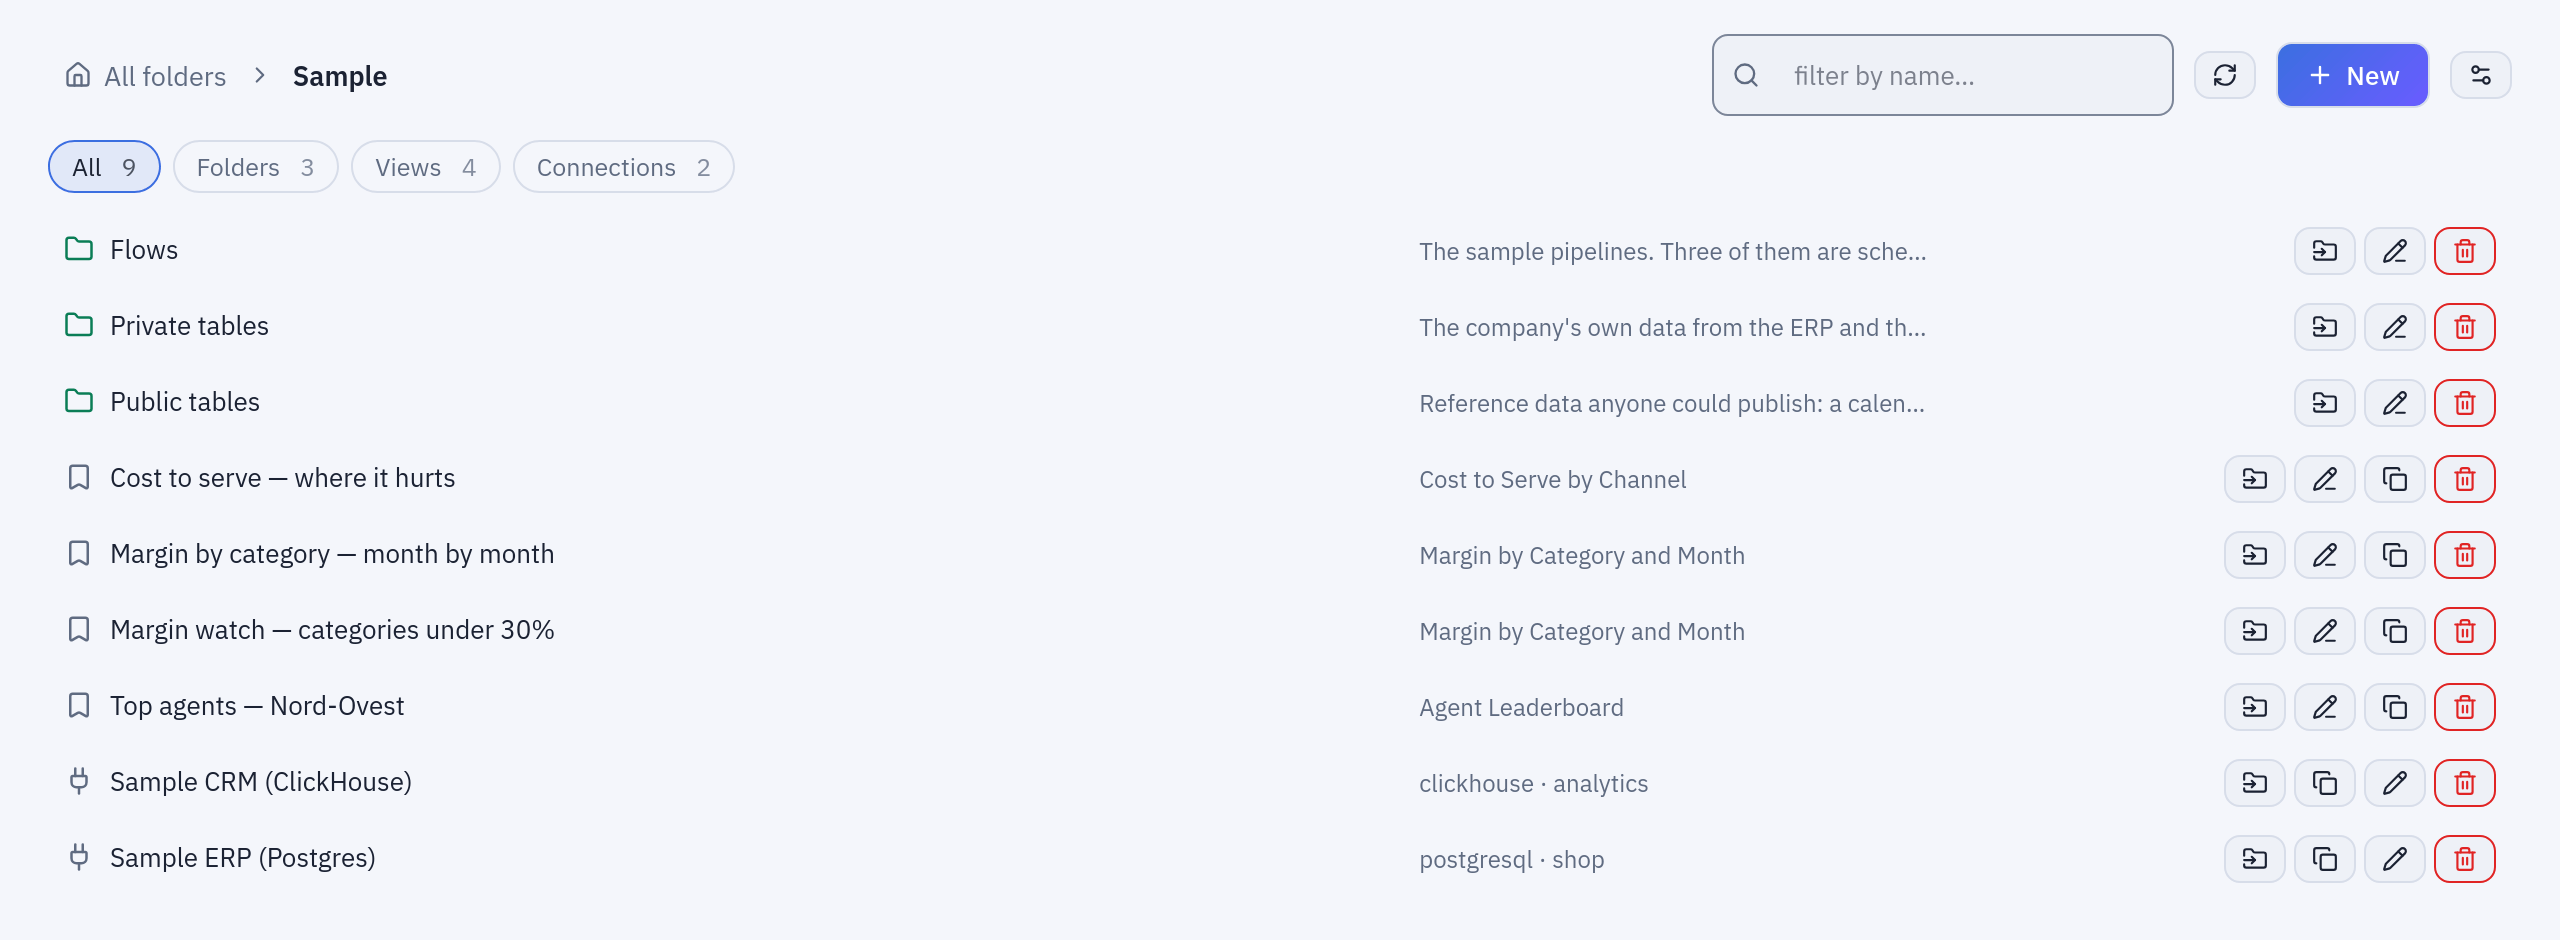
Explore in the Sample folder: the subfolders Flows, Private tables and Public tables, the saved views and the two connections, with a filter by kind at the top.
Permissions are granted on a folder, to a user or to a group, and hold for every folder below it. There are five:
| Permission | Allows |
|---|---|
| VIEW | seeing the folder and opening what it holds, its connections excepted |
| RUN | VIEW, and running its flows, refreshes and flow groups |
| EDIT | RUN, and creating, changing, moving and deleting what it holds |
| MANAGE | everything, including the folder's permissions and its subfolders |
| CONNECT | seeing, using and creating the folder's connections, and nothing else; MANAGE includes it |
Grants only add: there are no deny rules. Administrators can do everything. Access to data follows the same rules: a flow, a script or the AI assistant reads only the datasources its user may see.
Connections and datasources
A connection holds where a system is and how to sign in to it. Its secrets are encrypted at rest and never returned by the API. Creating, testing or reading through a connection needs CONNECT on its folder.
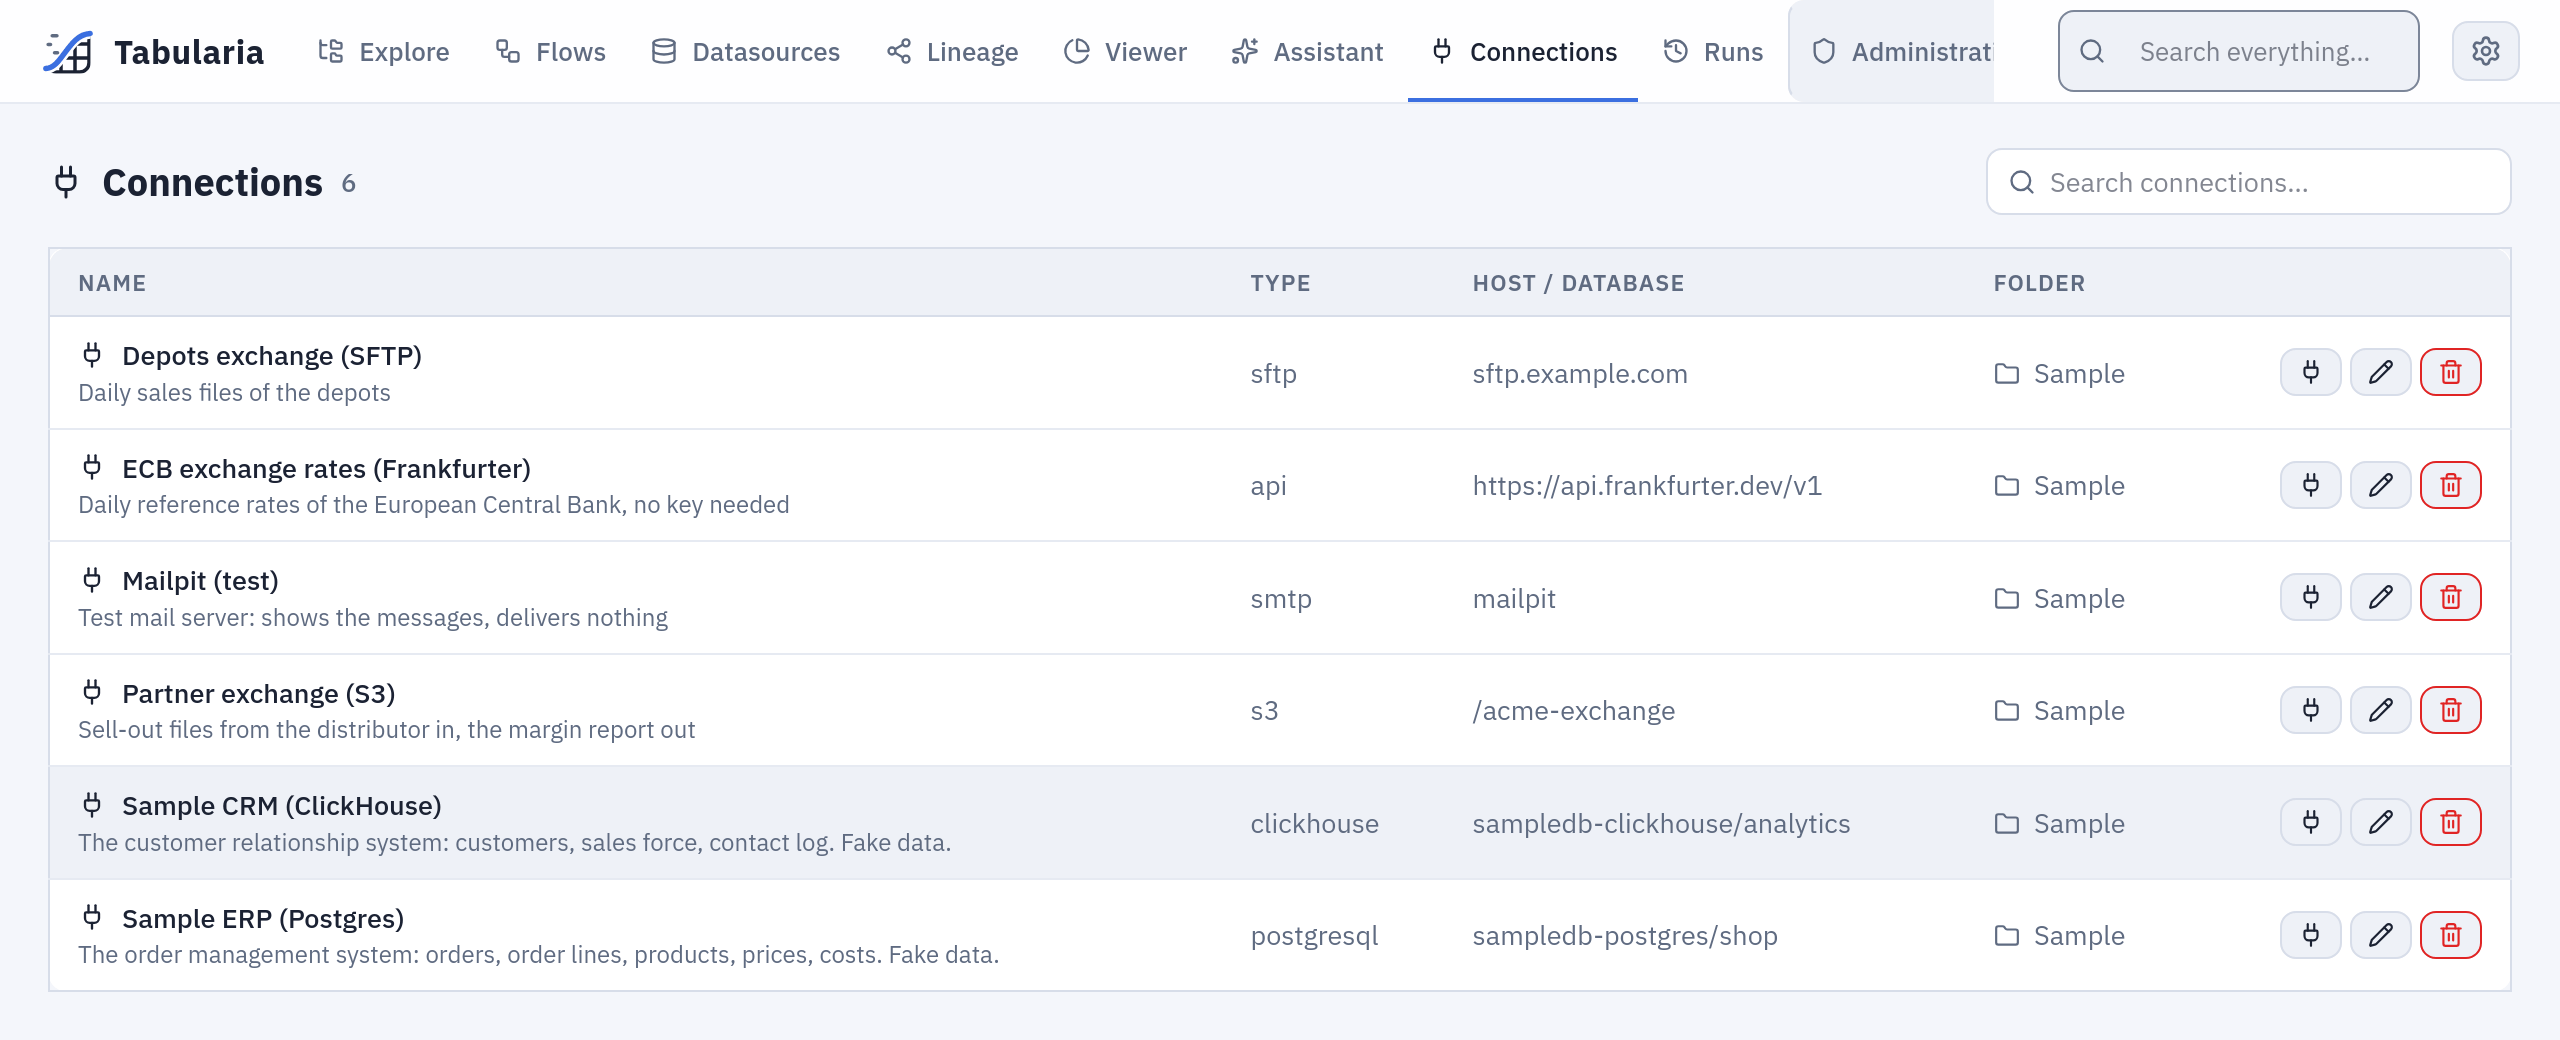
The Connections page lists every connection you can see, with its type, address and folder.
A datasource is the unit of data everyone else works with: a name in a folder, a schema, field descriptions and, when you want one, a data contract. Its rows are a parquet snapshot in the object storage. A datasource is made by:
- «Datasource from a database» in Explore, which reads a table or a query through a connection (databases, an SFTP or S3 folder, an HTTP API, SharePoint) and keeps the result; a refresh reads the source again, by hand or on a schedule, and replaces the snapshot (or appends by key, for the sources that support it);
- an Output node of a flow that publishes its result as a datasource;
- a SQL script that writes its result into a datasource.
Files can also be uploaded straight into a flow from the editor's toolbar («Upload file»). Reading from a datasource never touches the source system: flows, the Viewer and the assistant read the snapshot.
Flows, engines and previews
A flow is a graph drawn in the editor: source nodes that read datasources, operations (select, filter, join, group by, pivot, compute, SQL…) and Output nodes that write the result: a datasource, a database table, a file on SFTP or S3, an email. On Kubernetes, Script and Container nodes run your code and your images as steps of the same flow.
Saved, a flow is a declarative description, not code for one engine. At preview or run time the gateway turns each Output's branch into a list of typed operations, for example:
[
  {"type": "group_by", "params": {"by": ["codice", "nome", "categoria"],
    "aggregations": [{"column": "ricavo_netto", "func": "sum", "alias": "ricavo"}]}},
  {"type": "sort", "params": {"by": "ricavo", "descending": true}},
  {"type": "limit", "params": {"n": 20}}
]
and an engine executes it: Polars (the default), DuckDB or chDB inside the workers, or an external ClickHouse or Google BigQuery. A flow has a development engine, used by the editor, and an optional production engine, used by schedules and «Run in production». The engines follow one data standard; the differences that remain are listed in Engine differences.
A preview is what you see when you click a node: the result of the flow up to that step, computed on the whole dataset unless a development sample is set on the source node (or the installation sets an automatic one). Previews run on workers of their own, so they never wait behind a run; a newer preview of the same step replaces one still running; the output of intermediate steps is cached up to a size cap, so changing the last step usually does not recompute the first ones.
Every save that changes a flow keeps a version; an old version can be brought back. More in Flows and Preview and analysis.
Runs and history
A run is one execution: of a flow, of a datasource refresh, of a SQL script, of a
script or of a flow group. It is queued, taken by a worker and closed as SUCCESS or
FAILURE, with the engine it ran on, its timings, the rows it wrote and, when it failed,
the error. The Runs page lists them, with who started each or whether a schedule
did; a run's result can be downloaded. The log a script or a
container printed is kept with the run for ORCHESTRATOR__LOG_RETENTION_DAYS days.
Scripts, flow groups and schedules
- Python and R scripts run as Kubernetes Jobs in environments an administrator defines; they are saved in folders with their versions, and run on their own, in a flow (Script node) or in a flow group. Kubernetes only: Python and R.
- SQL scripts run SQL on the catalog's datasources, with the engine you choose, or on a database through a connection, and can write a datasource: SQL scripts.
- A flow group is a grid of steps: the cells of a step run in parallel (flows, datasource refreshes, scripts, SQL scripts, container images, Pushmail emails), the steps one after the other, and a failed step stops the group: Flow groups.
- A report is a page designed in millimetres over datasets, with parameters, read on screen and downloaded as PDF or Excel; it has no schedule of its own: a flow group's Pushmail cell sends it after the data is refreshed: Reports.
- A schedule is a cron expression on a flow, a datasource refresh, a script, a SQL
script or a flow group, read in the installation's time zone (
APP__TIMEZONE). A scheduled run acts with the permissions of the person who set the schedule: Scheduling.
Inputs and outputs can carry dynamic dates such as
sales_{yesterday:yyyyMMdd}.csv, resolved at every run.
Users, groups and service accounts
- Users sign in with an email and a password, or through single sign-on with an OIDC provider (Single sign-on with Keycloak).
- Groups collect users; permissions granted to a group hold for its members. With SSO, groups can follow the identity provider's groups or roles.
- Administrators see and change everything, as a personal flag or as members of an administrators group. Observers read the administration pages without changing anything.
- Service accounts are integrations, not people: they have no password, receive permissions like a user and call the API with tokens (API).
Every sign-in, change, run, export and permission change is written to the audit log.
Architecture in brief
                 Browser
          pages │       │ API calls (HTTPS)
                ▼       ▼
 Frontend (Nuxt)        Gateway (FastAPI) ──────── PostgreSQL
                        sign-in, permissions,      users, folders, flows,
                        audit, schedules, runs     runs, schedules, audit
                             │ internal token
                             ▼
                        Engine API (FastAPI) ───── Valkey
                             │                     queues, step-cache index,
                             ▼                     preview slots, counters
                        Celery workers
                        «celery»: runs, imports, exports
                        «preview»: previews
                             │
         ┌───────────────────┼──────────────────────┐
         ▼                   ▼                      ▼
   Object storage      External engines       Your databases, SFTP,
   raw/ datasets/      ClickHouse, BigQuery   S3, HTTP APIs, SMTP
   cache/ out/         (optional)
| Component | Role |
|---|---|
| Frontend | The web interface. The browser calls the gateway directly. |
| Gateway | The only entry point: sign-in, permissions, audit log, the metadata. Its orchestrator role fires the schedules and runs flows and flow groups; it can run as a separate process (APP__ROLE). |
| PostgreSQL | The metadata: users, groups, folders, flows and their versions, connections, runs, schedules, the audit log. |
| Engine API | Internal, reachable only by the gateway: turns every preview and run into a task for the workers. |
| Valkey | The Celery broker, the index of the step cache, the preview slots, the counters behind the metrics. Any Redis-compatible server works. |
| Workers | Celery processes on two queues, running the in-process engines and the clients of the external ones. Beat schedules the periodic housekeeping. |
| Object storage | One S3-compatible bucket (MinIO, AWS S3, Google Cloud Storage…): raw/ uploads, datasets/ snapshots, cache/ steps, out/ results. |
| Kubernetes Jobs | On Kubernetes, scripts and container images run as Jobs in namespaces of their own, with limits and network policies. |
The interactive diagrams: runtime architecture and metadata database schema.
Example: from a database table to a daily report
The Sample folder of the development stack, step by step:
- A connection.
Sampleholds the connection «Sample ERP (Postgres)» to the order system. - Datasources. In
Sample / Private tables, the datasourcesorder_rowsandproductsare snapshots of the tablesvendite.righe_ordineandcatalogo.prodotti, read through that connection. - A flow. In
Sample / Flows, «Top 20 Products by Revenue» readsorder_rows, computes the net revenue of each line, joinsproducts, groups by product, sorts by revenue and keeps 20 rows. Clicking any node previews its result. - An output. Its Output node publishes the datasource «Top 20 Products by Revenue»
in
Sample / Private tables, which the Viewer, the assistant and other flows can read. - A schedule. The flow runs at
30 5 * * *, every day at 05:30, on its production engine; each run appears on the Runs page. - Permissions. A sales team given VIEW on
Sample / Private tablesreads the report; nobody in it needs CONNECT on the ERP connection, because the report reads the snapshot, not the database.
Good to know
- Python and R scripts, Script and Container nodes need Kubernetes; on Docker Compose they are greyed out with the reason. SQL scripts work everywhere.
- A datasource is a snapshot: it is as fresh as its last refresh or publish.
- An administrator decides which engines may be chosen; the external ones exist only once configured.
- Docker Compose is for trying Tabularia; production runs on Kubernetes with the Helm chart (Kubernetes and Helm).