Integrations
Tabularia fits into the rest of a data stack in two directions: other systems drive it and read from it (the API, tokens and webhooks, single sign-on, metrics), and it reports to them (lineage events, the audit log, a dbt project, the data itself in your object storage and databases). This page is the map: one line per integration, and the page that explains it.
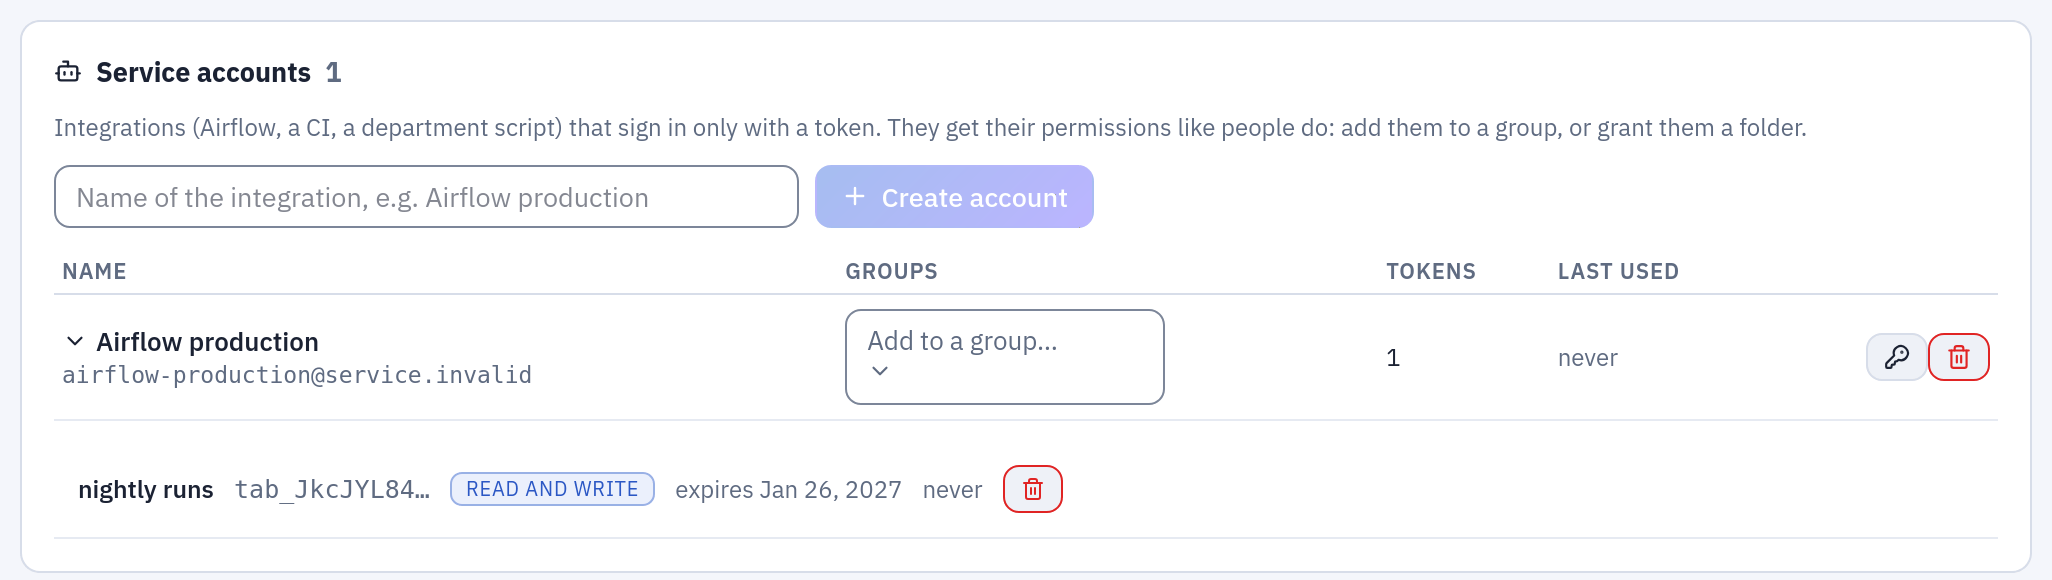
A service account for an external scheduler and its token, as in the example below.
The map
| Integration | What it does | Set up in | Page |
|---|---|---|---|
| AI models | The chat over the catalog, the assistants of the flow and script editors, the descriptions and SQL translations of the dbt export. Anthropic, and any OpenAI-compatible endpoint. | Providers and models in Administration → AI models; also AI__BASE_URL, AI__SECRET_KEY | AI |
| API, tokens and webhooks | Run flows, refresh datasources, read runs and lineage, download data from scripts and schedulers; be called when a run ends, with an HMAC signature. | Settings → API tokens, Administration → Service accounts, Administration → Webhooks | API, tokens and webhooks |
| dbt | Export a flow as a dbt project: one model per output, sources.yml, schema.yml, the data contract as tests. | The Flows page, «Export flow» (administrators) | Export to dbt |
| OpenLineage | Tell an external catalog (Marquez, DataHub, OpenMetadata…) what every run read and wrote: flows, refreshes, SQL and saved scripts, flow groups and their cells, containers, notebook sessions. | OPENLINEAGE__URL or OPENLINEAGE__FILE | OpenLineage |
| Single sign-on | Sign in through an OIDC provider (Keycloak, Microsoft Entra ID…), with its groups or roles mapped onto Tabularia's groups. | OIDC__* variables, oidc.* in the Helm chart | Single sign-on with Keycloak, SSO and group mapping |
| SIEM | Forward every audit log entry to Splunk through the HTTP Event Collector, within seconds. | Administration → SIEM | Audit log to Splunk |
| Monitoring | Prometheus metrics, health checks, a Grafana dashboard, the Performance, Queue and Cluster pages. | Included in Docker Compose; your own stack on Kubernetes | Monitoring |
| Data connections | Read from and write to databases, SFTP servers, S3 buckets, HTTP APIs, SharePoint and SMTP servers. | Connections, in a folder | Connections |
| Container registries | Run images from Harbor, GitHub, GitLab, Docker Hub or a cloud registry as steps of a flow (Kubernetes). | Administration → Container registries | Container registries |
External orchestrators such as Airflow drive Tabularia through the API: a service
account token starts a flow (POST /flows/{id}/run-now) and a webhook, or polling
GET /runs/{id}, tells them when it ended. There is no plugin to install.
How integrations reach Tabularia
- Inbound calls authenticate with an API token in the
Authorizationheader. A personal token acts with its owner's permissions; a service account is an integration rather than a person, with its own permissions on folders, and is the right choice for a scheduler or a CI job. Tokens are read-only or read-write, always expire, and every action they take is in the audit log under the token's name. - Outbound calls (webhooks, the SIEM, OpenLineage, the AI endpoint) are configured by an administrator or by the environment, never by a flow. Webhooks are signed, and retried when the receiver fails.
- What leaves the installation is decided per integration: OpenLineage sends only metadata (names, schemas, query texts, counts and times, never rows); the SIEM sends audit entries; webhooks send the run's outcome. What the assistants send to the model is described in AI.
Example: an external scheduler runs a flow
An administrator creates a service account airflow in Administration → Service
accounts, grants it RUN on the folder Sample / Flows and EDIT on
Sample / Private tables, where the flow publishes its datasource, and creates a
read-write token for it. The scheduler then starts the flow «Top 20 Products by Revenue» (id 42
here) and waits for it:
curl -X POST -H "Authorization: Bearer tab_…" \
  "https://tabularia.example.com/api/flows/42/run-now?mode=production"
# 202 {"run_id": 2212, …}

curl -H "Authorization: Bearer tab_…" https://tabularia.example.com/api/runs/2212
# {"id": 2212, "status": "SUCCESS", …}
Instead of polling, a webhook on flow.run.succeeded and flow.run.failed, limited to
the same folder, calls the scheduler's endpoint when the run ends. The details, the
stable endpoints and the signature check are in the API guide.
No lock-in
These facts keep your work yours:
- Open source and self-hosted. Tabularia is licensed under the AGPL-3.0 and runs on your infrastructure, with Docker Compose or the Helm chart.
- Your data stays in an open format on your storage. Every datasource and run result is a parquet file in your S3-compatible bucket or Google Cloud Storage, and Output nodes write to your own databases.
- Open interfaces. Everything the interface does goes through the same REST API,
described by the OpenAPI page the gateway serves at
/docs. - Open lineage. Runs are reported in the OpenLineage standard to the catalog you choose.
- Portable flows. A flow exports as a dbt project you can run without Tabularia.
Related
- Concepts: the objects these integrations act on
- Configuration reference: every environment variable
- Kubernetes and Helm