Getting started with Docker Compose
From an empty machine to a first scheduled flow, in about half an hour. You install Tabularia on one machine with Docker Compose, load the sample data, build a flow that filters, computes and aggregates, publish its result as a datasource, and let it run every night.
This is the trial stack: it builds the images from the repository and runs the
main branch with development settings. To run Tabularia for real, use Kubernetes and
the Helm chart: Kubernetes and Helm.
Every command and click below was run, in this order, on a clean machine (Docker in
Docker, a fresh git clone of main). The screenshots come from that run.
- 1. Prerequisites
- 2. Get the code
- 3. Configure
- 4. Start
- 5. Create the administrator
- 6. Load some data
- 7. Build your first flow
- 8. Schedule it
- 9. Where to go next
- 10. Stop, update, back up, reset
- Troubleshooting
1. Prerequisites
Docker. Docker Engine with the Compose plugin, version 2.24 or later (the
docker compose command, not the old docker-compose). This guide was run with Docker Engine 29 and Compose 5 on
x86_64 Linux; Docker Desktop on macOS and Windows works the same way. Check:
docker version
docker compose version
git to get the code, or a browser: on GitHub, Code → Download ZIP gives the same
files (the folder is then Tabularia-main). Nothing else: no key to generate, no file
to edit.
Resources. Measured on the clean run:
| Measured | Give Docker at least | |
|---|---|---|
| CPU | 8 cores used for the first build | 4 cores |
| Memory | 2.6 GB at rest, with the sample data | 8 GB. The engine and the two workers may grow to 4–6 GB each while they work (14 GB together): with less memory for Docker, lower BACKEND_MEM_LIMIT, WORKER_MEM_LIMIT and PREVIEW_WORKER_MEM_LIMIT in .env |
| Disk | 13.5 GB after the first start, with the sample data (images and build cache take most of it) | 20 GB free |
| Time | 2 min 42 s for the first docker compose up -d (8 cores, a fast connection); then about 15 s until the sign-in page answers | count 5–15 minutes on a laptop or a slower link |
With Docker Desktop the memory is set in Settings → Resources.
Free ports. The stack publishes these ports on 127.0.0.1 only: open the browser on the same machine.
| Port | Service |
|---|---|
| 3000 | the app |
| 8000 | the gateway (the API the app calls) |
| 3001 | Grafana |
| 9001 / 9002 | MinIO console / MinIO S3 API |
| 5433 | PostgreSQL (Tabularia's metadata) |
| 5434, 8124 | the sample databases (PostgreSQL, ClickHouse), unless you leave the sample data out |
On Linux, this prints the ones already taken (nothing printed: all free):
ss -ltn | grep -E ':(3000|3001|8000|9001|9002|5433|5434|8124)\b'
On a remote server the browser needs both 3000 and 8000 on its own
localhost: the app calls the gateway athttp://localhost:8000. Forwarding only 3000 is not enough.
Architecture. Compose builds the images for your machine's architecture. This guide was run on amd64; the release images on Docker Hub are published for amd64 and arm64 from the same Dockerfiles.
2. Get the code
As your normal user (not root):
git clone https://github.com/JumpAsAService/Tabularia.git
cd Tabularia/infrastructure
Every docker compose command of this guide runs from this infrastructure folder.
Linux only. The app container runs as user id 1000 and writes into the
frontendfolder of your clone. Ifid -uprints something other than1000, or you cloned as root, give it that folder before starting:sudo chown -R 1000:1000 ../frontend. On macOS and Windows there is nothing to do.
3. Configure
Nothing to do for a trial. At the first start the stack creates the key that encrypts
the passwords of your database connections (in the keys volume, kept with the data),
and the sign-in page creates the administrator (step 5).
To change a setting later, for example the time zone of the schedules, copy the example settings and edit the copy:
cp .env.example .env
# the time zone of the schedules: '0 6 * * *' means 06:00 here (an IANA name; default UTC)
APP__TIMEZONE=Europe/Rome
Then docker compose up -d again. Dates on screen follow your browser. Every setting,
with its default: Configuration reference.
4. Start
docker compose up -d
The first time, Compose builds the images (the engine, the gateway, the app, the sample data loader) and pulls the others: 2–3 minutes on a fast machine, 5–15 on a laptop. The command returns when every container has started. Then check:
docker compose ps
postgres, redis, minio, gateway, sampledb-postgres and sampledb-clickhouse
must say (healthy); the others Up
(cadvisor reports health: starting for its first minute). A container that says
Restarting has a problem: see Troubleshooting.
The logs of one service, for example the gateway:
docker compose logs --tail 50 gateway
The app compiles its pages when it starts: the sign-in page answers about 15 seconds
after up returns.
| Service | URL | Credentials |
|---|---|---|
| Tabularia | http://localhost:3000 | the administrator you create at the first visit |
| Gateway (API) | http://localhost:8000 | through the app's sign-in, or an API token |
| Grafana | http://localhost:3001 | read-only without signing in; admin / admin to edit (GRAFANA_ADMIN_* in .env). The same dashboards are in the app, under Administration → Monitoring |
| MinIO console | http://localhost:9001 | minioadmin / minioadmin (STORAGE__ACCESS_KEY / STORAGE__SECRET_KEY) |
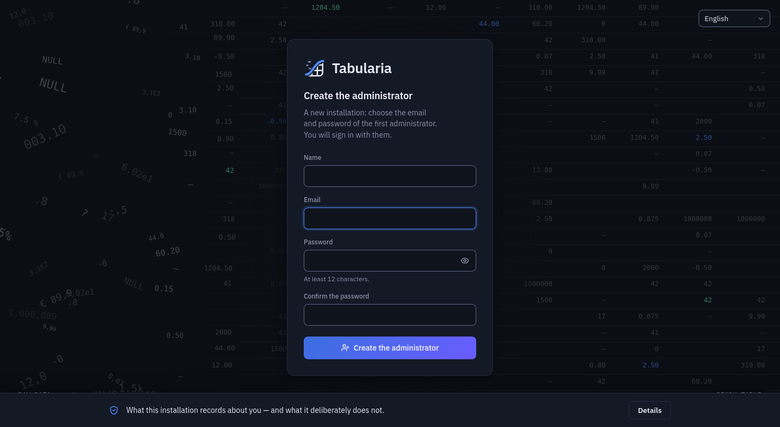
5. Create the administrator
Open http://localhost:3000. The first time, the page asks for the administrator: a name,
an email and a password (at least 12 characters; admin and other well-known passwords
are refused), typed twice. Create the administrator signs you in. The page appears
only while the installation has no account at all; from then on it is the ordinary
sign-in, with that email and password.
The installation opens on Explore. The sample data (step 6) arrives a minute or two
later: reload the page to see the Sample folder.
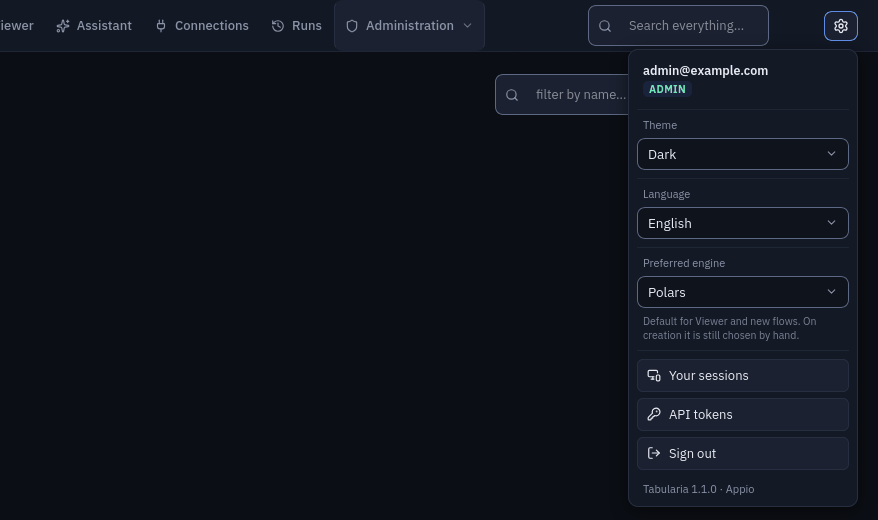
Theme and language are in the gear at the top right: five themes (Dark, Light, Dracula, Monokai, Imperium) and five languages (English, Italiano, Français, Deutsch, Español). The choice is kept by your browser. The same menu has Your sessions, API tokens and Sign out.
6. Load some data
a. The sample data (already there)
A fictional cured-meats company: an ERP on PostgreSQL and a CRM on ClickHouse, with a
ready-made Sample folder in Tabularia. It is part of the stack: three containers, the
two databases and sampledb-init, which fills them, waits for the administrator of
step 5, signs in as that administrator and builds the folder. At the small scale the
data takes seconds; the container then runs the eleven sample flows once and makes the
views, the reports and the dashboard, about two minutes. Follow it:
docker compose logs -f sampledb-init
While no administrator exists it says waiting for the administrator: open
http://localhost:3000 and create it. It ends with DONE. The «Sample» folder is ready: …
and exits; docker compose ps -a then shows it Exited (0), as it should. It runs again at
every docker compose up -d and finds everything already there.
Reload Explore: the Sample folder holds the two connections (Sample ERP (Postgres),
Sample CRM (ClickHouse)), four saved views, the reports Margin review and Agent scorecard
(Reports), the dashboard Sales overview
(Dashboards), and three folders: Flows (eleven flows,
three of them scheduled), Private tables (the company's tables and the flows' results)
and Public tables (a calendar, the regions).
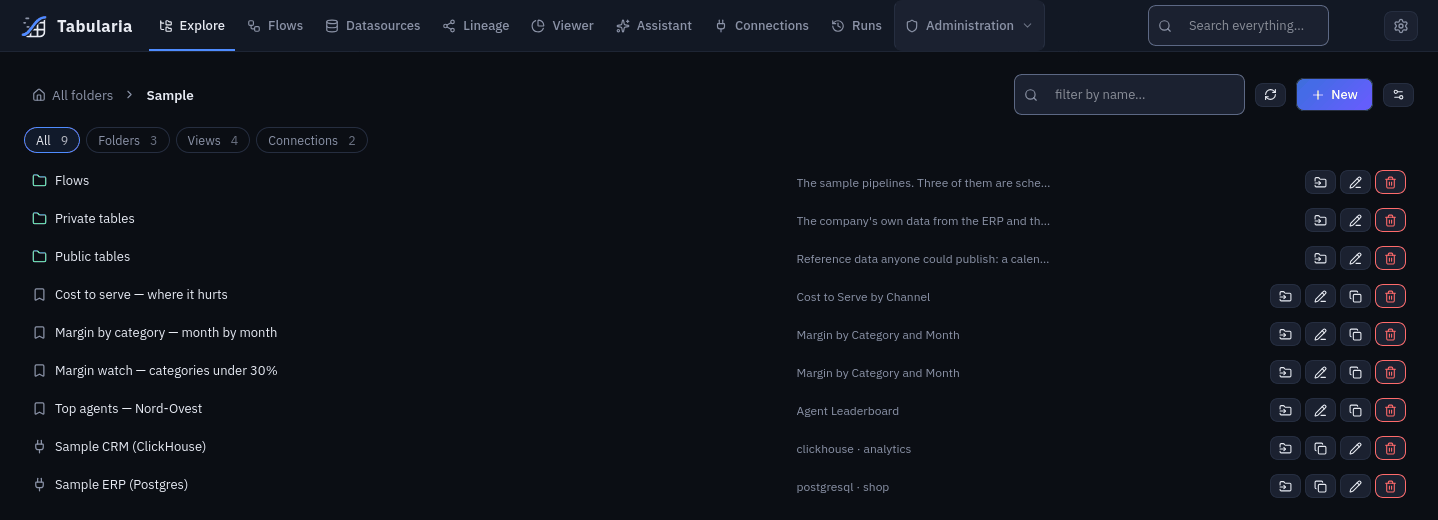
The folder is created with no permissions on it: the administrator sees it, other users only once the administrator shares it. More: the sample database.
b. Or a file of your own
CSV, TSV, JSON, Excel and parquet files are loaded from the flow editor: in a new flow (step 7, first two clicks), Upload file in the toolbar. The file becomes the flow's source and the preview shows it at once. An Excel workbook is read from its first visible sheet; when it has more than one, a window lists them and every sheet you tick becomes a source of its own.
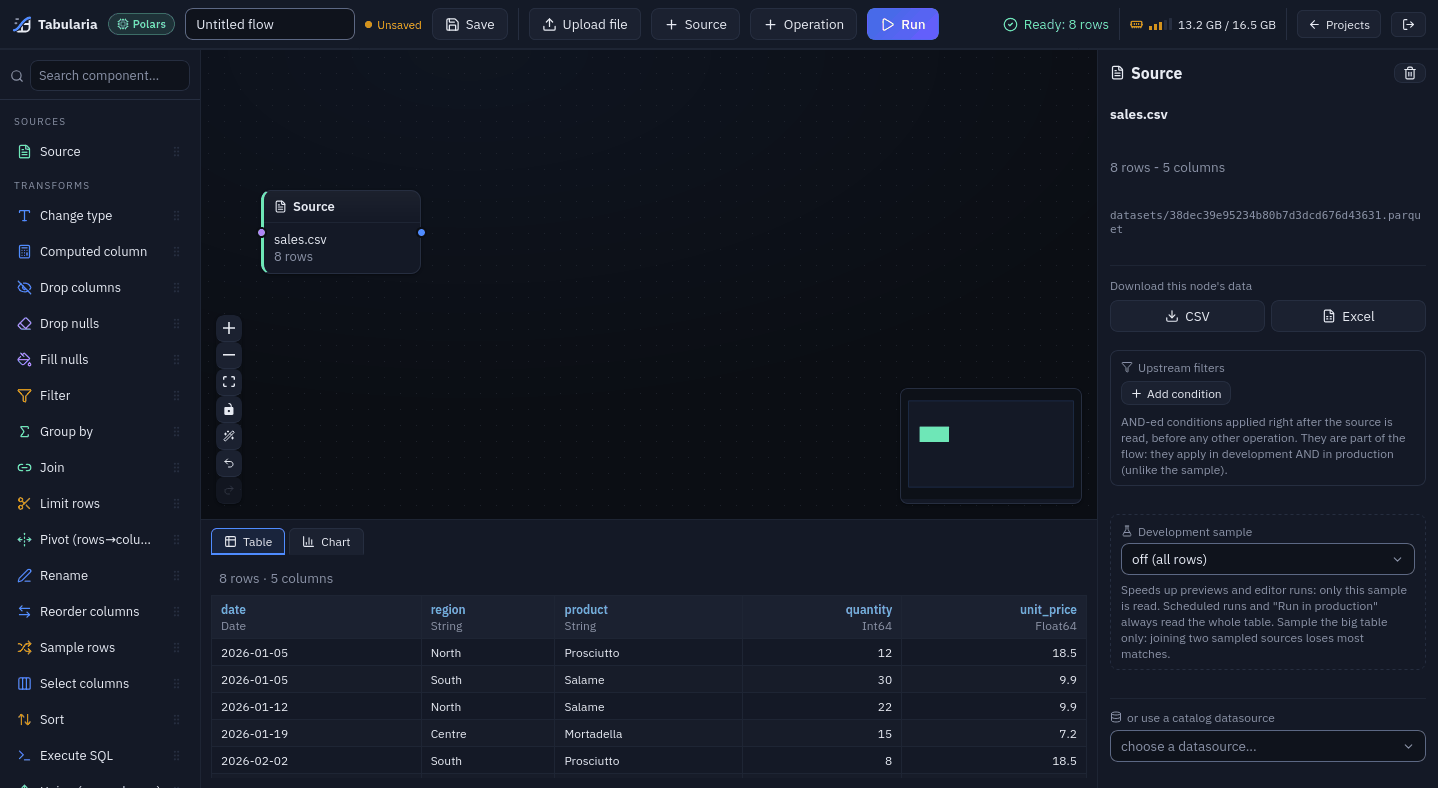
An uploaded file belongs to that flow. To turn it into a datasource others can use, publish it with an Output node, as in step 7.
7. Build your first flow
The flow: from the sample orders table, keep the shipped orders, add the order year,
count the orders by sales channel and year, and publish the result as a datasource.
With your own file, the steps are the same with your columns.
1. A folder. In Explore, at All folders, click New, type My first flows
and click Create. The new folder opens.
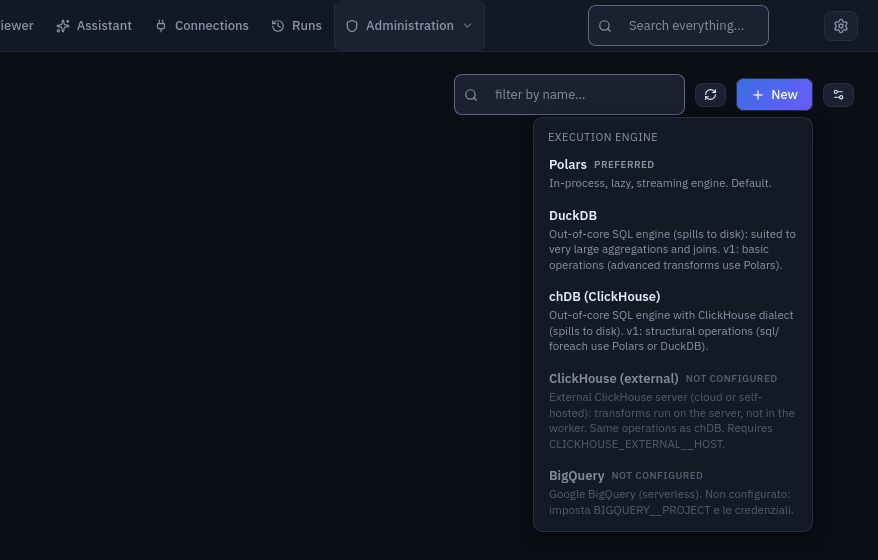
2. A flow. In the folder, New → New flow, then pick the engine: Polars. The editor opens with one empty Source node.
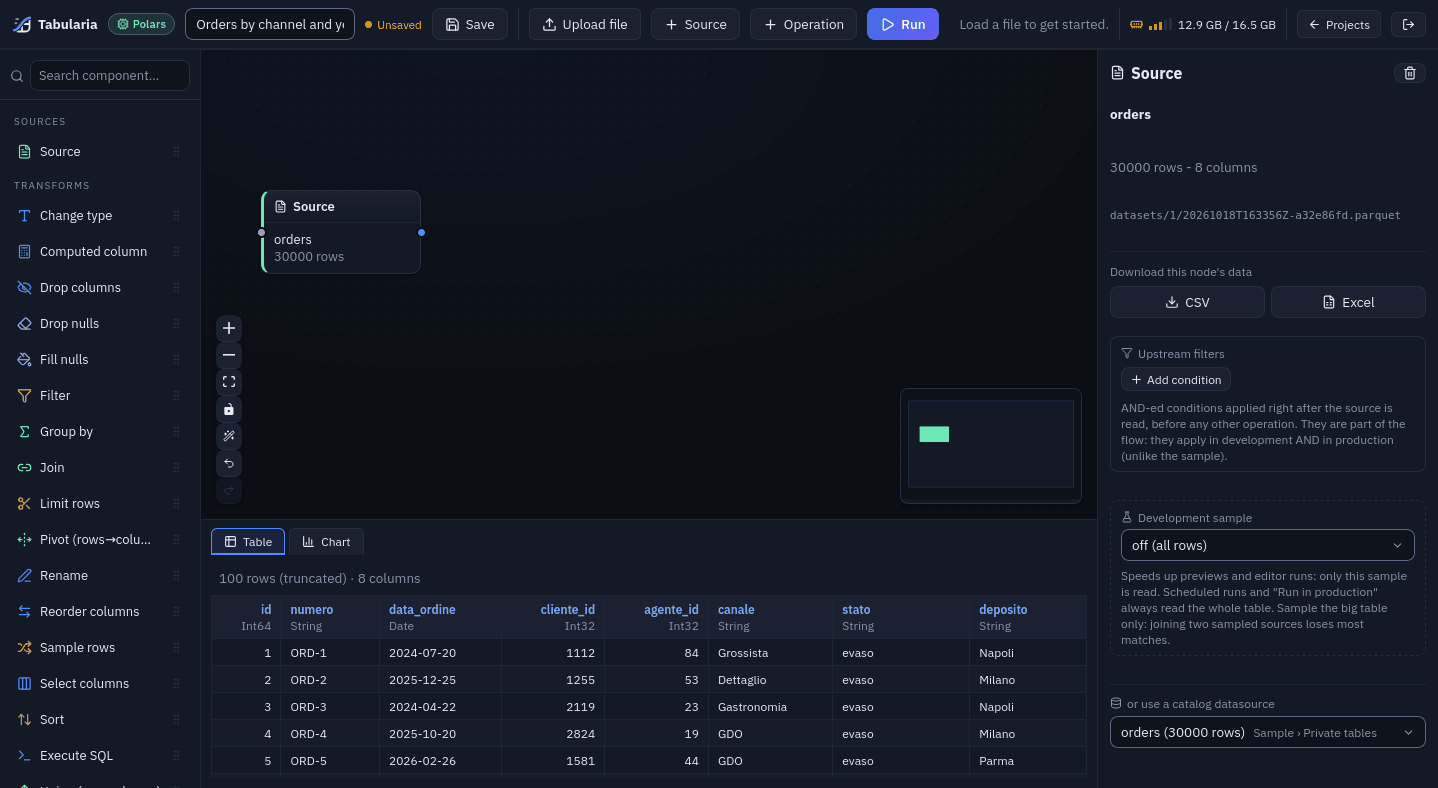
3. Name it. Click the name field at the top left (Untitled flow) and type
Orders by channel and year.
4. The source. The Source node is selected: in the right panel, under
or use a catalog datasource, open choose a datasource…, type orders and pick
orders (30000 rows) Sample › Private tables. The grid at the bottom previews the
table.
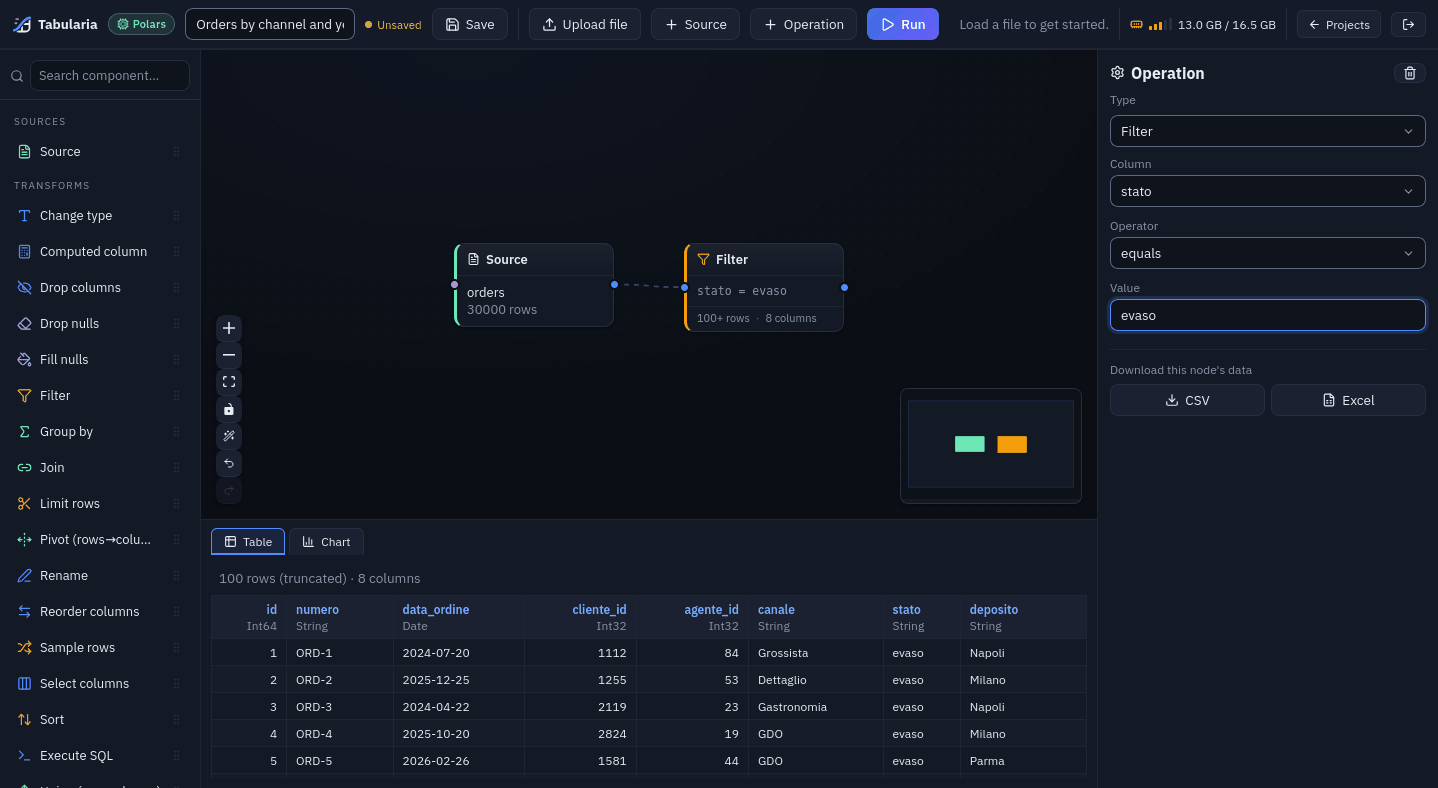
5. A filter. Click + Operation in the toolbar. A new step appears after the
selected node, already connected, as Change type with a red required parameter
missing: 'columns': it is waiting for its settings. In the right panel set Type to
Filter, then Column stato, Operator equals, Value evaso (shipped)
and press Enter. The preview shows only shipped orders.
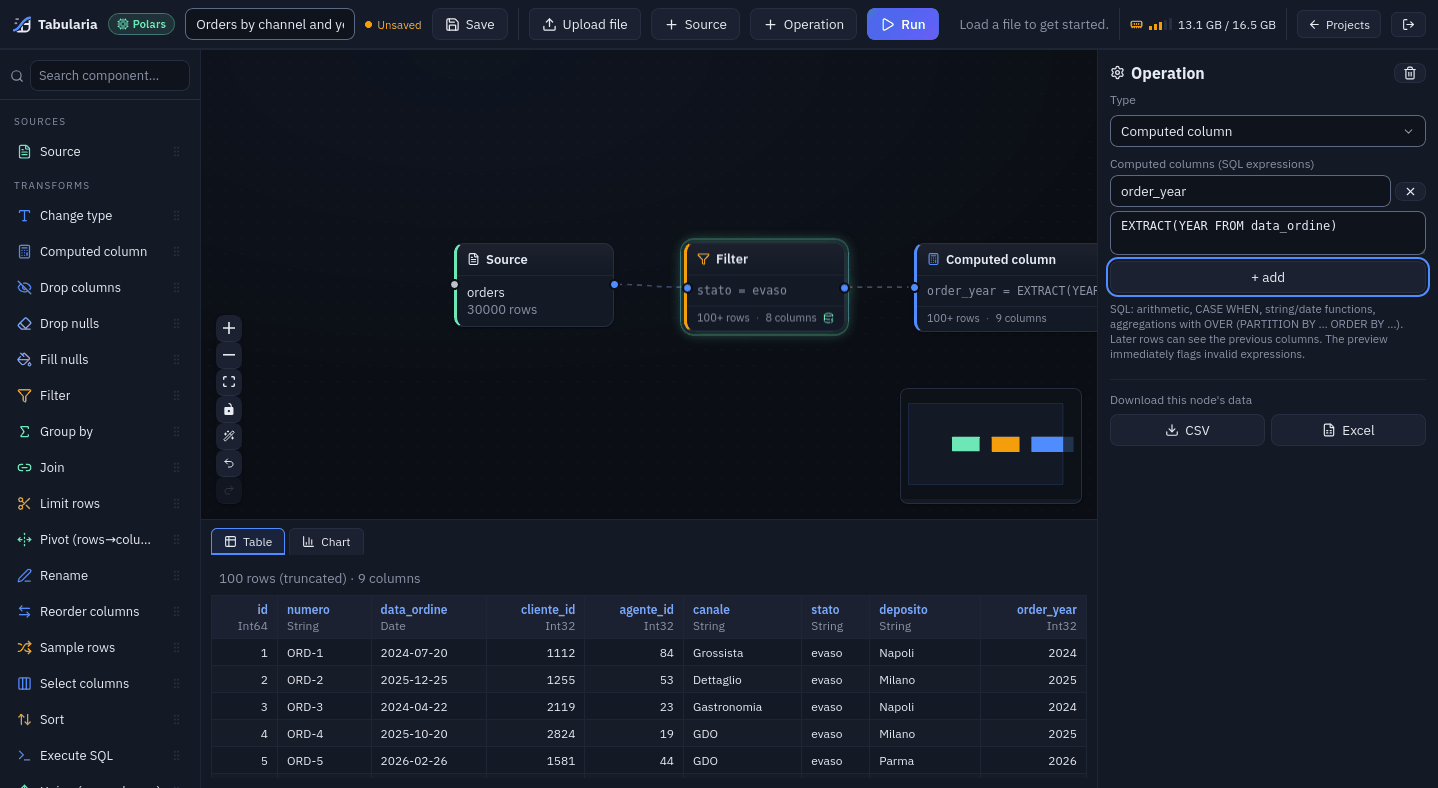
6. A computed column. + Operation again, Type → Computed column. In the
first box type the column name order_year, in the second the SQL expression
EXTRACT(YEAR FROM data_ordine), then press Tab. The preview gains an order_year
column. A wrong expression is reported in the preview while you type.
7. A group by. + Operation, Type → Group by. Tick canale and
order_year. Under Aggregations click + add, choose the column id, the function
count, and type orders as the alias. The preview now has one row per channel and
year.
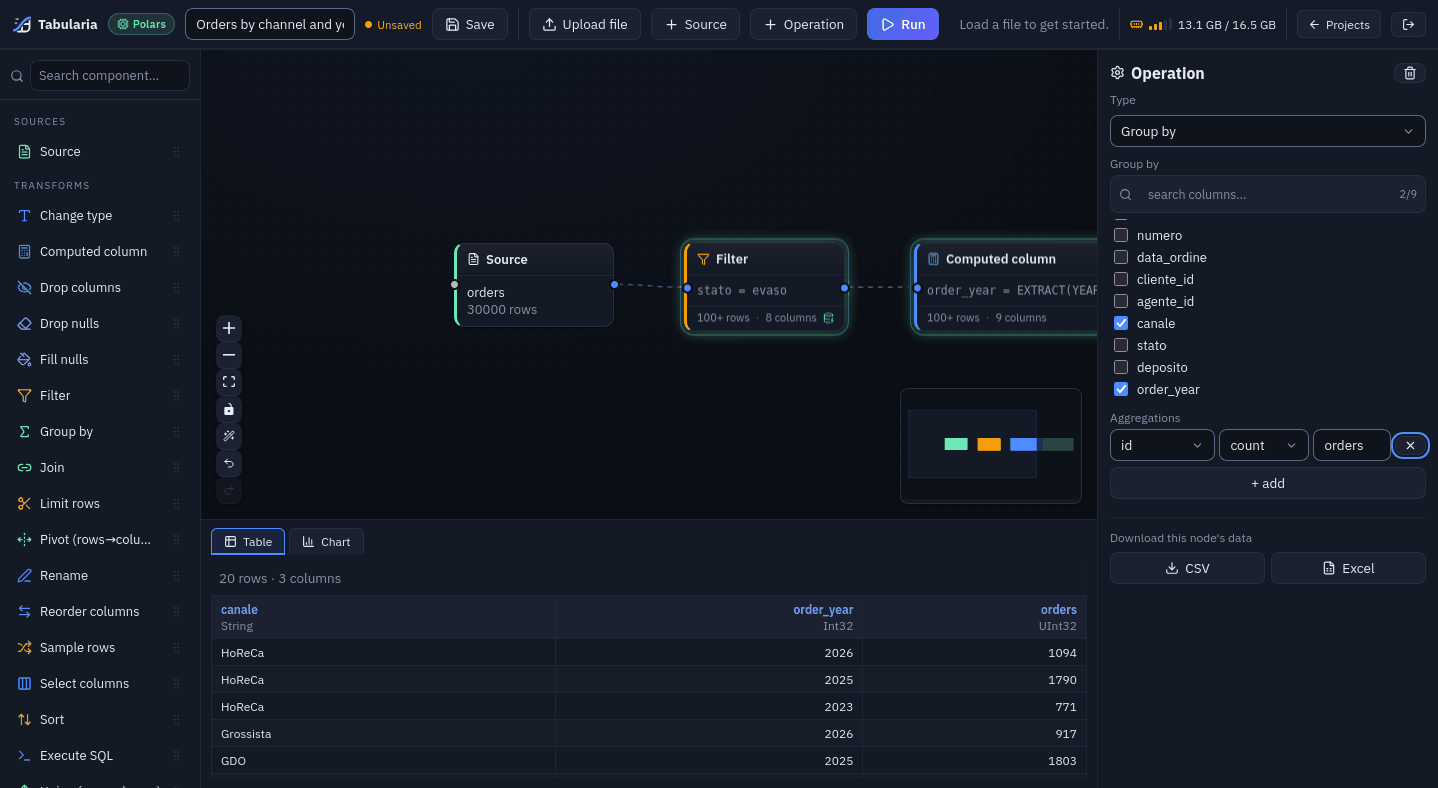
Preview any step. Click any node of the canvas: the grid shows that step's output. The steps already computed are kept in a cache (the green glow), so going back to them is fast.
8. The output. At the bottom of the left sidebar, drag Output (datasource / database) onto the canvas, to the right of Group by. Connect them: drag from the small dot on the right edge of Group by to the dot on the left edge of the Output. With the Output selected, in the right panel:
- Destination: Tabularia Datasource (the default);
- Datasource name:
shipped_orders_by_channel_year; - Folder:
My first flows; - Description:
Shipped orders per sales channel and year; - tick Overwrite if it already exists: every later run, the scheduled ones too, refreshes the same datasource.
The wand button in the canvas controls (Arrange the flow) lines the nodes up.
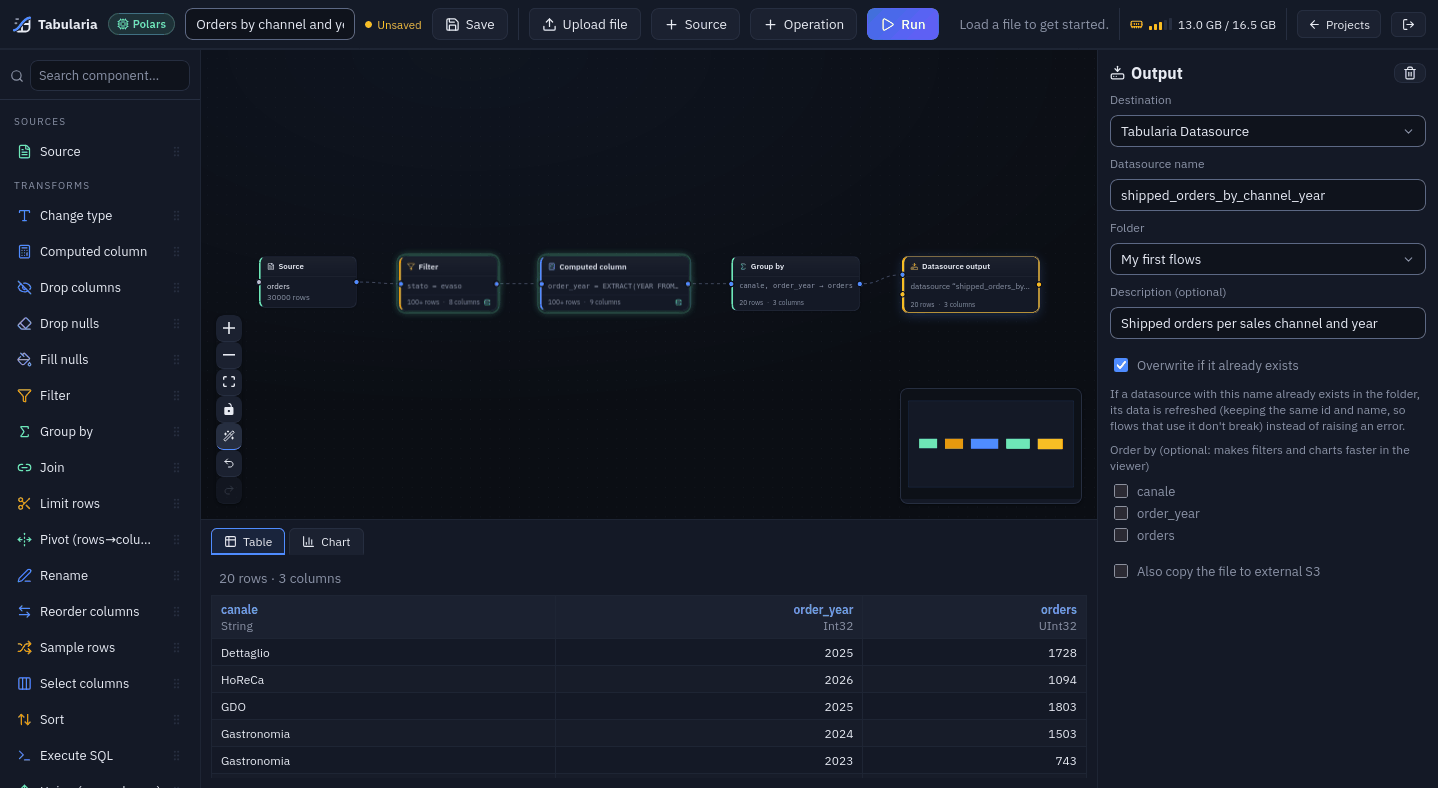
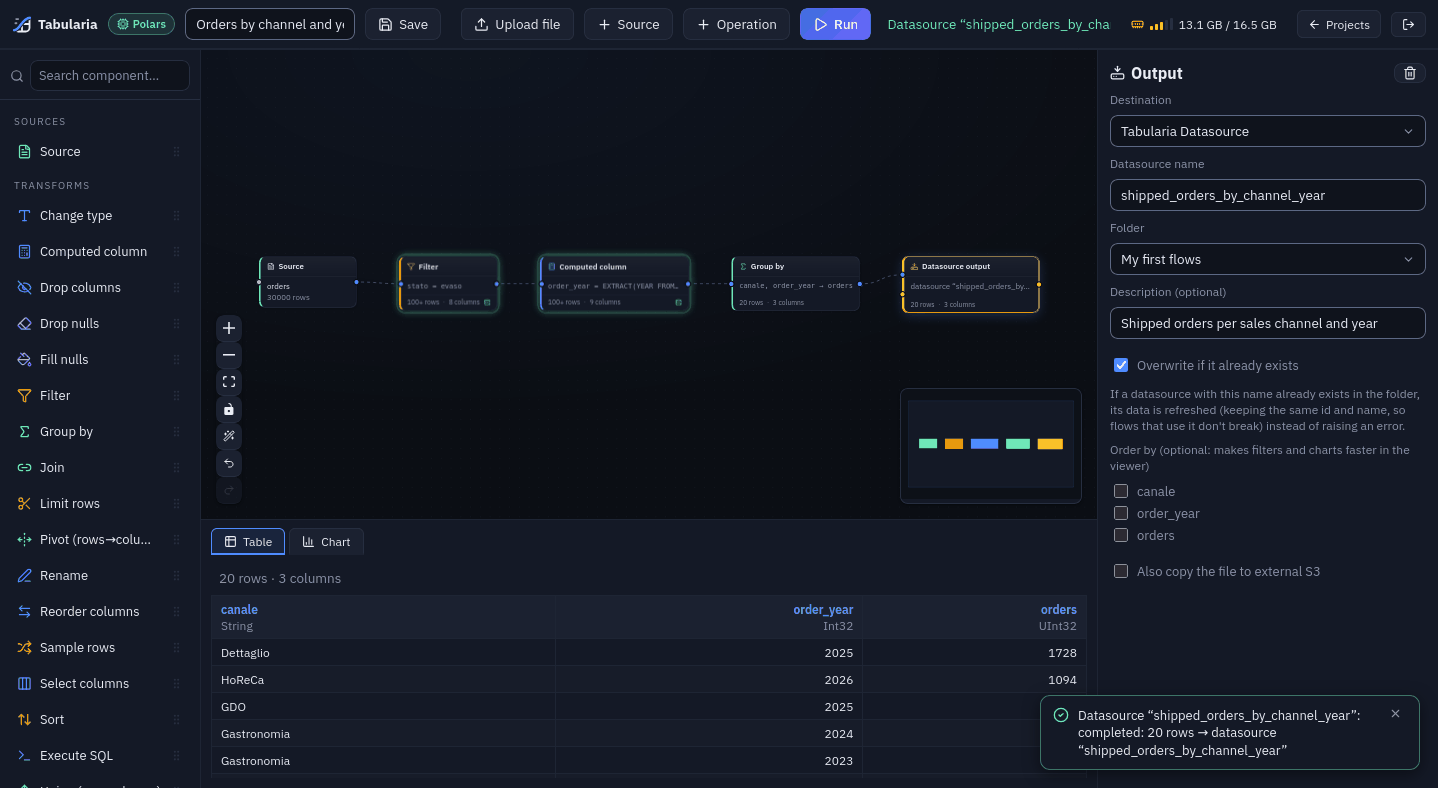
9. Save. Save in the toolbar (or Ctrl+S): Flow "Orders by channel and year"
saved, and the address becomes /editor?flow=<id>.
10. Run. Run in the toolbar opens Run flow: the flow runs on the whole dataset, on a worker, and launches one run per Output. Click Run. A couple of seconds later the toolbar and a notification say Datasource "shipped_orders_by_channel_year": completed: 20 rows → datasource "shipped_orders_by_channel_year".
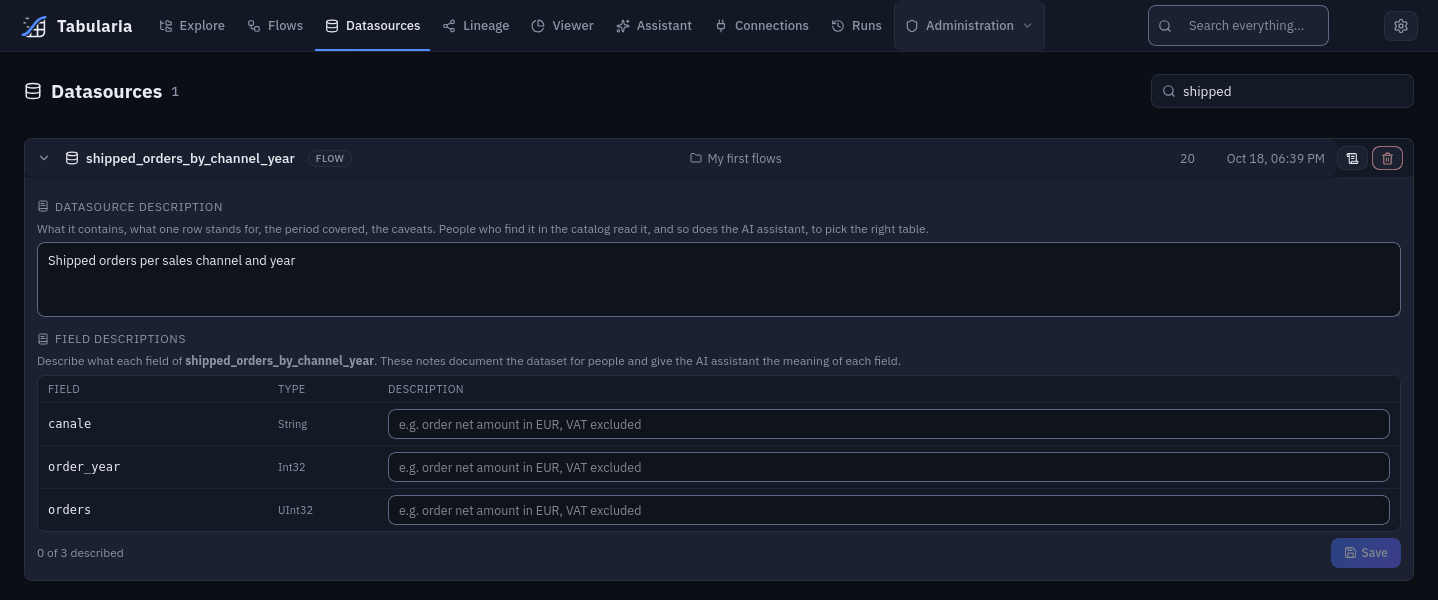
11. The result. Datasources in the top bar lists it (search shipped); click it
to read and edit its description and its fields' descriptions. Analysis → Viewer
opens it for filters, pivots and charts without changing it. Runs has the run: the
page opens on Failed, click All.
8. Schedule it
Flows in the top bar lists every flow. On the row of Orders by channel and year, click the calendar button (Schedule run).
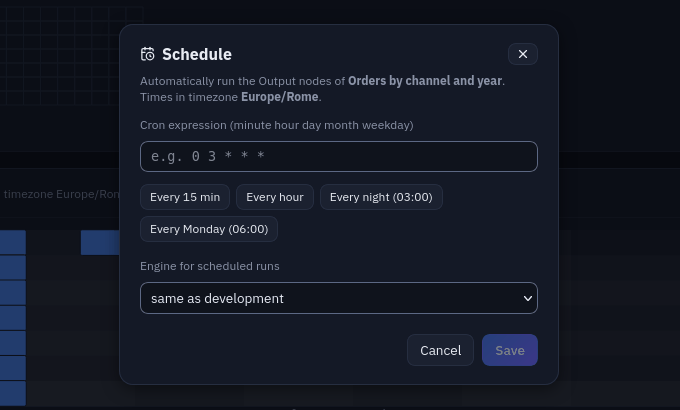
- Cron expression: minute, hour, day of month, month, day of week, read in the time
zone of
APP__TIMEZONE(the dialog shows it). The presets fill it in: Every 15 min, Every hour, Every night (03:00), Every Monday (06:00). Every day at 06:00 is0 6 * * *. - Engine for scheduled runs: same as development (the engine the flow was built with) or another one, for example a ClickHouse or BigQuery engine once configured. The editor keeps working with the development engine.
Click Save. The row gets a scheduled badge (hover it for the cron) and the Schedule load panel above the list places the flow's runs on the coming week.
To see it fire now, set the cron two minutes ahead: at 18:11, 13 18 * * *. At 18:13
(in APP__TIMEZONE) Runs shows a new run whose author is schedule. Then put
the real schedule back.
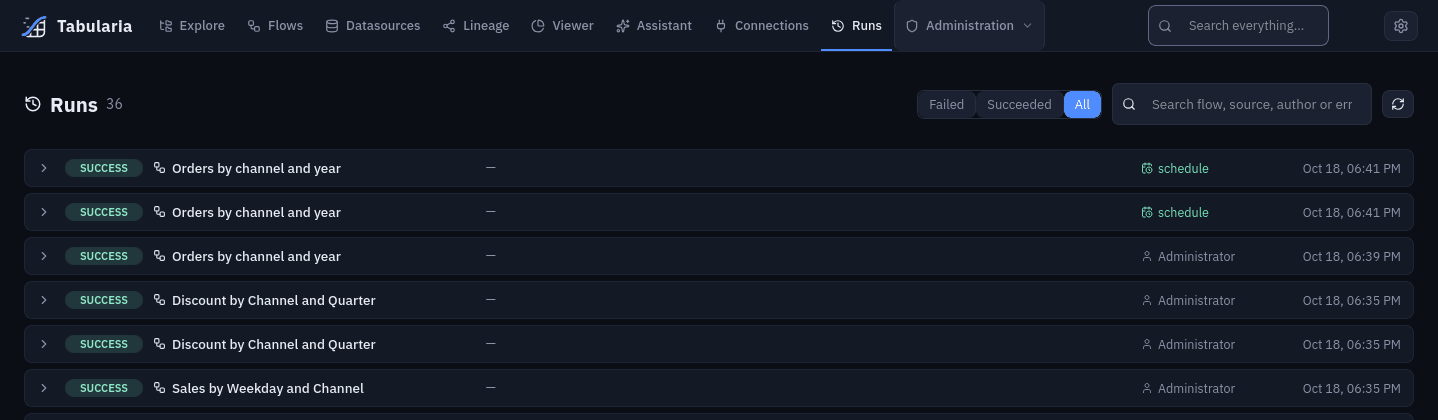
A scheduled run reads the whole table, never the development sample, and with Overwrite if it already exists it refreshes the same datasource each time.
9. Where to go next
Your databases. In a folder, New → New connection: PostgreSQL, MySQL, MariaDB, ClickHouse, Trino, Oracle, Microsoft SQL Server, S3, SMTP, SharePoint, SFTP, HTTP API. Then New → Datasource from a database reads a table or a query into a snapshot that flows use and that you refresh by hand or on a schedule. The two sample connections are working examples. SQL Server needs its driver in the image: Microsoft SQL Server.
Files on a server. An SFTP connection reads the files of a folder that match a pattern, stacks them into one table, and writes flow results back as files: SFTP. The same for a bucket: S3 buckets.
An HTTP API. A datasource «API call» turns the answers of a REST/JSON API into a table. The guide walks through free APIs field by field, starting with the ECB exchange rates from Frankfurter, no key needed: HTTP APIs, examples.
Dates that move by themselves. {today-30} in an API path, a file name or an
output name becomes a date at each run, in the time zone you choose:
Dynamic dates in inputs and outputs.
SQL on the catalog. Explore → New → SQL script: SQL over the datasources you can read, run with Ctrl+Enter, saved with its versions in a folder and shared with it: SQL scripts.
Data contracts. The Data contract button of a datasource (in Datasources and Explore) declares its columns, types and rules on the values; every new load is checked, with a warning or an error, and the contract exports to ODCS. See the overview.
Export to dbt. On the Flows page, Export flow → dbt turns a flow into a dbt project for your data team, with the data contract as tests. Read its limits before relying on it: Export to dbt.
Python, R and your own images (Kubernetes only). The Script node (Python and R
code in environments an administrator builds), saved scripts and the Container node
(images from your container registries) run as Kubernetes Jobs, so this stack does not
have them. You still see them, greyed out, with the reason when you point at them: the
Scripting environments and Container registries sections of Administration, the
Script and Container nodes in the editor's sidebar (they cannot be dragged), and
New → Script (Python or R) in Explore. A flow made on a cluster with these nodes
opens and saves as it is; a run that reaches one of them fails, saying that scripting
or containers are off on this installation. Administration → Backups, the automatic
backups of the database, is greyed out as well: on this stack back up the postgres
service with its own pg_dump. To try them on your own computer, use
minikube or a kind cluster; what they do is in
Python and R in flows and The Container node.
Production. Kubernetes and the Helm chart: Kubernetes and Helm, then the install and upgrade checklist.
10. Stop, update, back up, reset
All from the infrastructure folder.
Stop and start again, keeping everything:
docker compose stop
docker compose start
docker compose down also removes the containers (not the data); docker compose up -d
creates them again.
Update to the latest main:
git pull
docker compose up -d --build
Compose rebuilds what changed and recreates those containers; the gateway upgrades its database schema by itself when it starts. With nothing new it takes seconds.
Back up. The data lives in Docker volumes named after the folder:
infrastructure_postgres_data (users, flows, schedules, connections, runs),
infrastructure_minio_data (the datasets, as parquet files) and infrastructure_keys
(the key that encrypts the connection passwords: without it they cannot be read). Stop
the stack, archive the three, keep .env with them if you made one, start again:
docker compose stop
mkdir -p ~/tabularia-backup
for v in postgres_data minio_data keys; do
  docker run --rm -v infrastructure_$v:/data -v ~/tabularia-backup:/backup alpine \
    tar czf /backup/$v.tgz -C /data .
done
[ -f .env ] && cp .env ~/tabularia-backup/env
docker compose start
Restore into empty volumes (after a reset, or on another machine): create the containers and volumes without starting them, unpack, start.
docker compose create
for v in postgres_data minio_data keys; do
  docker run --rm -v infrastructure_$v:/data -v ~/tabularia-backup:/backup alpine \
    tar xzf /backup/$v.tgz -C /data
done
docker compose up -d
Reset. down -v removes the containers and every volume:
docker compose down -v
-vdeletes all the data: users, flows, schedules, connections, run history, every dataset, the sample databases. Only the images and your.envremain. Without-v,docker compose downkeeps the data.
To also free the disk the images and the build cache take (11–13 GB):
docker compose down -v --rmi all
docker builder prune -f
Troubleshooting
The messages below are the real ones, reproduced on the clean run.
The gateway never becomes healthy: SECURITY__FERNET_KEY is not valid. A key was
set in .env but is not a key (typed by hand, cut short). docker compose logs gateway
shows:
RuntimeError: SECURITY__FERNET_KEY is not valid (Fernet key must be 32 url-safe base64-encoded bytes.): …
Remove the SECURITY__FERNET_KEY= value from .env (the stack then uses the key it
created) or generate a real one with openssl rand -base64 32 | tr '+/' '-_', then
docker compose up -d.
The gateway never becomes healthy: SECURITY__KEYS_DIR must be writable by the services. The images were built before the keys volume existed: docker compose up -d keeps the images it already has. Rebuild them; the keys-init container then gives
the volume to the services:
git pull
docker compose up -d --build
A port is already in use.
Error response from daemon: failed to set up container networking: driver failed programming external connectivity on endpoint dataprep-frontend (…): failed to bind host port 127.0.0.1:3000/tcp: address already in use
Another program holds the port (another Tabularia, another dev server). Stop it, then
recreate the container that failed: the container is left running without its port,
and a plain up -d or restart does not bind it again.
docker compose up -d --force-recreate frontend
The app keeps restarting: EACCES: permission denied, mkdir '/app/.nuxt'. On
Linux, docker compose ps shows frontend Restarting (1) and
docker compose logs frontend this error. The clone belongs to a user other than id
1000: see the note in step 2, then
docker compose up -d --force-recreate frontend.
Not enough memory. A worker that runs out of memory is killed and restarted:
docker compose ps shows it Restarting (137), previews or runs never answer, and
docker inspect -f '{{.State.OOMKilled}}' infrastructure-preview-worker-1
prints true. Give Docker more memory (Docker Desktop: Settings → Resources); the
ceilings of the engine containers are BACKEND_MEM_LIMIT, WORKER_MEM_LIMIT and
PREVIEW_WORKER_MEM_LIMIT in .env.
The browser says Unable to connect. The app is not there yet: the first
docker compose up -d is still building (its output shows the build steps), or the app
is still compiling its pages. Wait for the gateway to be (healthy) in
docker compose ps; docker compose logs --tail 5 frontend ends with
Nuxt Nitro server built when the app is ready.
Sign-in fails: Incorrect email or password. Sign in with the email and password
of the administrator you created (or, if you set them in .env, AUTH__ADMIN_EMAIL and
AUTH__ADMIN_PASSWORD). After repeated failures the sign-in is paused: Too many sign-in
attempts. Try again in 60 seconds.
The gateway does not become (healthy). docker compose logs --tail 20 gateway
names the reason. Cannot create the administrator means an AUTH__ADMIN_PASSWORD set
in .env is admin, another well-known password or shorter than 12 characters: choose
another one, or remove the line to create the administrator at the sign-in page, and run
docker compose up -d again.
The Sample folder does not appear.
- The administrator was created a moment ago:
sampledb-initneeds about two minutes more (docker compose logs -f sampledb-init). - You are signed in as a user other than an administrator: the folder is shared with nobody until an administrator grants it.